Full Text
Introduction
Sepsis is a common cause of admissions into intensive care units. Sepsis and septic shock contribute to significant morbidity and mortality in the hospital.
Sepsis is defined as a life-threatening organ dysfunction caused by a dysregulated host response to infection [1]. The sequential organ failure assessment (SOFA) and the quick SOFA (qSOFA) scores have been introduced. The SOFA score has been widely validated for assessment of acute morbidity of critical illness [2] and consists of the following: platelet count, bilirubin, and creatinine levels, mean arterial pressure (MAP) or administration of vasoactive agents, altered mental status (based on the Glasgow Coma Scale), and PaO2/FiO2. There are many studies which show good correlation between SOFA scoring and mortality of patients [3-11].
Major risk factors of sepsis include advanced age, previous hospitalization, immunosuppression and genetic factors. Diabetes mellitus, a metabolic disorder that has become a global health burden partly due to its rising incidence, is another major risk factor for sepsis. In diabetics, immune response is altered and therefore infections are more common in diabetics. Poor glycemic control and hyperglycemia further increase the chance of infections in diabetics.
HbA1c gives us information regarding mean blood glucose concentration over the lifespan of red blood cells (120 days), and its value correlates best with mean blood sugar levels over the previous 8–12 weeks. HbA1c is widely used nowadays to diagnose diabetes and monitor glycemic control in diabetics. Studies have shown HbA1c as a predictive marker in diabetic patients with sepsis [8].
We wanted to study whether addition of HbA1c to SOFA score was helpful in predicting outcomes in diabetic patients with sepsis and septic shock.
Materials and methods
Study group included 98 diabetic patients admitted to hospital, both males and females, of age more than 18 years of age, with sepsis and septic shock and also having diabetes mellitus type-2. The study was a prospective, observational study, conducted in ICU of a tertiary care hospital (KIMS Hospitals, Secunderabad, India) over a period of 18 months (August 2017 to January 2019).
Data collected included age, sex, co-morbidities, diagnosis and SOFA score. Score was calculated at admission and every 48hrs in the ICU. Need for mechanical ventilation, vasopressors, acute kidney injury requiring hemodialysis and transfusions were studied. Oxygen requirements (FiO2), urine output, mental status (Glasgow Coma Scale) and mean arterial pressure (MAP) were measured for all patients included in the study. Institutional ethical committee approval was taken prior to conducting the study.
SOFA score was calculated as shown in table 1. This was calculated on admission and daily in ICU. Of the total 98 patients, HbA1c was done in 59 patients.
Table 1: Sequential organ failure assessment score (SOFA score).
|
Organ system
|
Score
|
|
0
|
1
|
2
|
3
|
4
|
|
Respiration PaO2/FiO2, mmHg
|
≥400
|
<400
|
<300
|
<200
|
<100
|
|
Coagulation platelets, x 103/ml
|
≥150
|
<150
|
<100
|
<50
|
<20
|
|
Live bilirubin, mg/dL
|
<1.2
|
1.2-1.9
|
2-5.9
|
6-11.9
|
>12
|
|
Cardiovascular hypotension
|
MAP≥70
|
MAP<70
|
Dopamine<5 or dobutamine (any dose)
|
Dopamine 5.1-15 or epinephrine≤0.1 or norepinephrine≤0.1
|
Dopamine>15, epinephrine>0.1 or norepinephrine>0.1
|
|
Central nervous system GCS score
|
15
|
13-14
|
10-12
|
6-9
|
<6
|
|
Renal creatinine mg/dl
|
<1.2
|
1.2-1.9
|
2-3.4
|
3.5-4.9
|
>5
|
Table 2: HbA1c score.
|
HbA1c
|
HbA1c score
|
|
< 7
|
0
|
|
7 - 7.9
|
1
|
|
8 - 8.9
|
2
|
|
9 - 9.9
|
3
|
|
10 and above
|
4
|
HbA1c score was given to HbA1c values as per table 2: H-SOFA score = HbA1c score + SOFA score (on admission); H-SOFA max score = HbA1c score + Max SOFA score (during hospitalization).
All patients were followed till discharge/ death/ transfer from ICU to ward and from there to discharge. The outcomes studied include in-hospital mortality and length of ICU stay. All the data were collected and coded in MS Excel spreadsheet. SPSS software version 23 was used for data analysis. Group comparisons were made using independent simple t-test for continuously distributed data and chi-square test for categorical data. Pearson’s correlation coefficient was calculated to explore the linear correlation between two continuous variables.
Results
Age > 75 years constituted the largest age group (table 3). Majority of the patients were men (nearly ¾) (table 4). There was no significant difference in outcomes in the two groups with regards to age or gender.
Table 3: Association of outcome with age.
|
Age (Years)
|
Outcome
|
Total
|
Chi-Square Test
|
|
Died (in-hospital mortality)
|
Discharged
|
|
N
|
%
|
N
|
%
|
N
|
%
|
χ2
|
P value
|
|
<= 60
|
3
|
9.1%
|
9
|
13.8%
|
12
|
12.2%
|
1.689
|
0.820
|
|
61 – 65
|
7
|
21.2%
|
15
|
23.1%
|
22
|
22.4%
|
|
66 – 70
|
7
|
21.2%
|
13
|
20.0%
|
20
|
20.4%
|
|
71 – 75
|
6
|
18.2%
|
15
|
23.1%
|
21
|
21.4%
|
|
>75
|
10
|
30.3%
|
13
|
20.0%
|
23
|
23.5%
|
|
Total
|
33
|
100.0%
|
65
|
100.0%
|
98
|
100.0%
|
Table 4: Association of outcome with gender.
|
Gender
|
Outcome
|
Total
|
Chi-Square Test
|
|
Died (in-hospital mortality)
|
Discharged
|
|
N
|
%
|
N
|
%
|
N
|
%
|
χ2
|
P value
|
|
Males
|
24
|
72.7%
|
43
|
66.2%
|
67
|
68.4%
|
0.437
|
0.647
|
|
Females
|
9
|
27.3%
|
22
|
33.8%
|
31
|
31.6%
|
|
Total
|
33
|
100.0%
|
65
|
100.0%
|
98
|
100.0%
|
Source of sepsis in almost half of the patients was pneumonia / lower respiratory tract infections. Urinary tract infection was the next most common cause (nearly 1/3) (Fig 1).
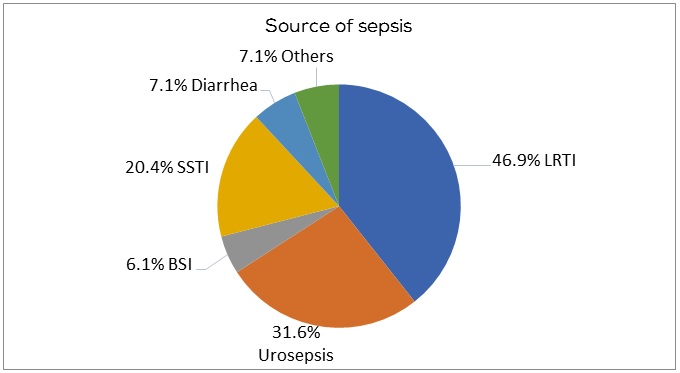
Figure 1: Distribution of the patients in terms of source of sepsis.
Out of 98 patients admitted, most of the patients (88.8%) had SOFA score of 9 or less. Most of the patients had therefore, less severity of organ dysfunction which would generally result in good prognosis. Only one patient was admitted with SOFA score >15 (Table 5).
Table 5: Percentage distribution of patients according to SOFA score at admission.
|
SOFA score
|
No. of patients
|
Percentage (%)
|
|
<6
|
67
|
68.40%
|
|
7 – 9
|
20
|
20.40%
|
|
10 – 12
|
5
|
5.10%
|
|
13 – 15
|
5
|
5.10%
|
|
>15
|
1
|
1.50%
|
Associations of outcomes (in-hospital mortality) were studied for HbA1c, SOFA score and H-SOFA score (HbA1c+ SOFA).
There was no significant difference in the two groups in terms of HbA1c score (χ2 = 2.321, p = 0.751) (table 6), suggesting that the intensity of glycemic control (as measured by HbA1c alone) had no effect on outcome in our study.
There was a significant difference in both the died and discharged groups in terms of SOFA Score (χ2 = 15.933, p = 0.001) (Table 7). Interesting to note that 1 patient who had the highest SOFA score (>15) survived.
There was a significant difference in the two groups in terms of H-SOFA Score (χ2 = 10.322, p = 0.022) (Table 8). So, when HbA1c was combined with SOFA score, this combined score correlated with worse outcomes.
Table 6: Association of Outcome with HbA1c score.
|
HbA1c score
|
Outcome
|
Total
|
Chi-square test
|
|
Died (in-hospital mortality)
|
Discharged
|
|
N
|
%
|
N
|
%
|
N
|
%
|
χ2
|
P value
|
|
0 (<7%)
|
4
|
28.6%
|
15
|
33.3%
|
19
|
32.2%
|
2.321
|
0.751
|
|
1 (7 – 7.9%)
|
3
|
21.4%
|
6
|
13.3%
|
9
|
15.3%
|
|
2 (8 – 8.9%)
|
3
|
21.4%
|
7
|
15.6%
|
10
|
16.9%
|
|
3 (9 – 9.9%)
|
0
|
0.0%
|
5
|
11.1%
|
5
|
8.5%
|
|
4 (>=10%)
|
4
|
28.6%
|
12
|
26.7%
|
16
|
27.1%
|
|
Total
|
14
|
100.0%
|
45
|
100.0%
|
59
|
100.0%
|
Table 7: Association of outcome with SOFA score.
|
SOFA score
|
Outcome
|
Total Number of Patients Admitted
|
Chi-square test
|
|
Died (in-hospital mortality)
|
Discharged
|
|
N
|
%
|
N
|
%
|
N
|
%
|
χ2
|
P value
|
|
<6
|
16
|
48.5%
|
51
|
78.5%
|
67
|
68.4%
|
15.933
|
0.001
|
|
7 - 9
|
9
|
27.3%
|
11
|
16.9%
|
20
|
20.4%
|
|
10 - 12
|
3
|
9.1%
|
2
|
3.1%
|
5
|
5.1%
|
|
13 - 15
|
5
|
15.2%
|
0
|
0.0%
|
5
|
5.1%
|
|
>15
|
0
|
0.0%
|
1
|
1.5%
|
1
|
1.0%
|
|
Total
|
33
|
100%
|
65
|
100%
|
98
|
100%
|
Table 8: Association of outcome with H-SOFA score (HbA1c score + SOFA score).
|
H-SOFA score
|
Outcome
|
Total
|
Chi-square test
|
|
Died (in-hospital mortality)
|
Discharged
|
|
N
|
%
|
N
|
%
|
N
|
%
|
χ2
|
P value
|
|
1 - 4
|
1
|
7.1%
|
17
|
37.8%
|
18
|
30.5%
|
10.322
|
0.022
|
|
5 - 7
|
6
|
42.9%
|
20
|
44.4%
|
26
|
44.1%
|
|
8 - 10
|
5
|
35.7%
|
5
|
11.1%
|
10
|
16.9%
|
|
11 - 14
|
1
|
7.1%
|
3
|
6.7%
|
4
|
6.8%
|
|
>=15
|
1
|
7.1%
|
0
|
0.0%
|
1
|
1.7%
|
|
Total
|
14
|
100%
|
45
|
100%
|
59
|
100%
|
The graph (Figure 2) summarizes the results of ROC analysis for the 3 scores for predicting mortality. It also mentions the best combination of sensitivity and specificity for each of the scores and the associated cutoffs. De Long’s test was used for pair wise comparison between the three ROC curves. H-SOFA score was comparable to SOFA score for predicting mortality (Z = -0.167, p = 0.864). H-SOFA (Max) score was better than SOFA score (Z = -3.661, p <0.001) and H-SOFA score (Z = -3.568, p < 0.001) for predicting mortality.
This means the highest SOFA score when combined with HbA1c showed best correlation with worse outcomes.
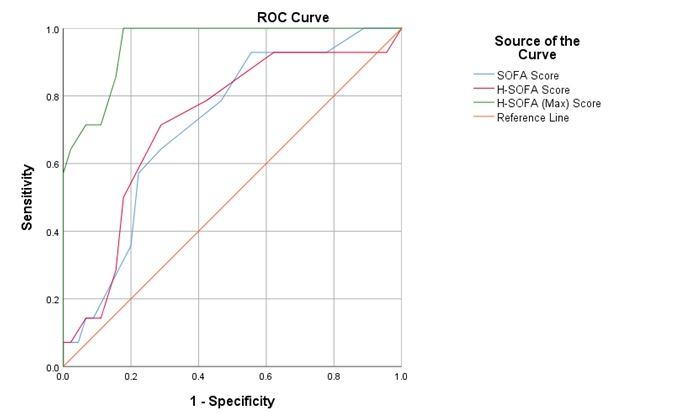
Figure 2: Comparison of diagnostic ability (ROC analysis) of the three scores for predicting mortality.
The mean length of ICU stay (Days) of the patients was 4.07 (±6.12) days. The length of stay ranged from 0-36 days (Figure 3). There was no significant correlation of HbA1c levels. There was a significant positive correlation of SOFA score, H-SOFA score, and H-SOFA (Max) score with length of ICU stay, with the strength of association being best for H-SOFA (Max) score, followed by H-SOFA score, and then SOFA score (Figure 4).
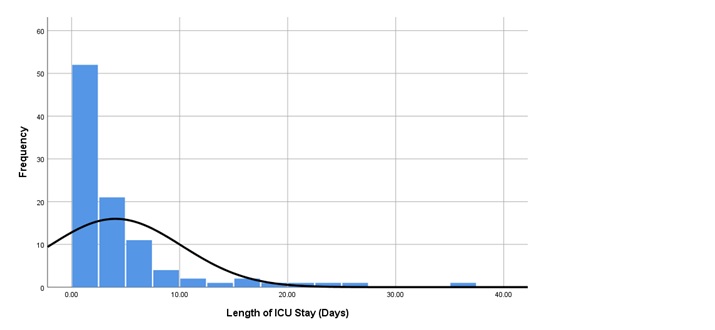
Figure 3: Distribution of the length of ICU stay.

Figure 4a-d: Correlation of different scores with length of ICU stay (Days).
The mean H-SOFA (Max) score in the died (in-hospital mortality) group was 12.21 (±2.78), and in the discharged group was 5.49 (±2.68). There was a significant difference in the two groups in terms of H-SOFA (Max) score (t = 7.978, p = 0.000), with the H-SOFA (Max) score being significantly higher in the died (in-hospital mortality) group (Table 9).
Table 9: Association of outcome and different scores.
|
|
Sequential organ failure assessment score (SOFA score)
|
SOFA score
|
|
SOFA score
|
SOFA score
|
|
SOFA score
|
7.48
|
4.00
|
4.18
|
3.20
|
4.118
|
0.000
|
|
SOFA (Max) score
|
10.79
|
2.60
|
4.23
|
3.16
|
10.969
|
0.000
|
|
H-SOFA score
|
7.64
|
3.37
|
5.49
|
2.68
|
2.189
|
0.042
|
|
H-SOFA (Max) score
|
12.21
|
2.78
|
5.49
|
2.68
|
7.978
|
0.000
|
Discussion
In this study done in a tertiary care hospital in India, we analyzed data of 98 patients admitted with sepsis and septic shock. We found that the overall in hospital mortality for patients admitted with sepsis and septic shock was nearly one-third (31 patients of 98). Majority of the patients who died (in hospital mortality) needed ventilator support. Most of them needed vasopressors and had Acute Kidney Injury (AKI). Pulmonary infections were the source of sepsis in almost half of the patients and urinary tract infection was the source in one third of them (Figure 1).
The newer scoring systems including SOFA are organ dysfunction scores, which may be measured repeatedly at fixed time intervals and have the ability to capture the dynamic nature of the clinical condition of the patient. SOFA score correlates with outcomes in terms of mortality and morbidity. Many studies have shown good correlation of SOFA score to poor outcomes in patients with sepsis [3-7, 10, 11].
Study by Jain et al depicted strong correlation of mortality with SOFA scores on day one which implied that SOFA score at admission can be helpful in triaging the patients into different risk categories [7]. In a study by Gupta et al, there was positive correlation between mortality and SOFA score at admission and at 48 hrs (7.84±3.74 and 8.64±3.72 respectively on admission and at 48 hrs) [4]. Ravi et al showed mean SOFA of 12.9±3.34 in non-survivors versus 7.94±3.6 in survivors [5]. In our study too, there was a significant difference of initial SOFA in both groups (mean SOFA at admission was 7.48±4 in non-survivors when compared to 4.18±3.2, p=0.000).
SOFA scoring can be assessed on a regular basis during hospitalization. Maximum SOFA is the highest score of a patient during hospitalization. This score can identify the critical point at which patients exhibit the highest degree of organ dysfunction during their ICU stay. Jain et al found that the Max SOFA score in survivors (3.92 ± 2.17) was significantly lower than non-survivors (8.9 ± 3.45) [7]. Qiao et al concluded that SOFA scores can accurately predict mortality outcome in critically ill elderly patients, especially the maximum SOFA score and the difference between the maximum and initial SOFA scores [6]. In our study, the mean of Max SOFA score was more in non-survivors than survivors (10.79±2.6 and 4.23±3.16 respectively), with a significant difference in between both the groups (t=10.969, p=0.000).
There are several studies which have shown correlation of glycemic control and poor outcomes. In a study by Ivan et al, admission HbA1c was significantly lower in surviving patients than in non-survivors (median 8.2% versus 9.75%, respectively; P<0.001) [8]. They concluded that HbA1c was an independent predictive factor for hospital mortality and hospital length of stay (LOS) of diabetic patients with sepsis. In another study by Sanders et al, HbA1c was positively correlated with LOS and ICU-referral, reflecting higher health-care utilization [9]. Lee et al observed that in patients with sepsis, the HbA1c level at ICU admission was associated with progression of organ dysfunction 72 hrs later and with ICU mortality [12]. However, in our study, there was no significant difference in outcomes when HbA1c alone was taken into consideration.
Our study was an attempt to study combining two variables (HbA1C and SOFA score) and study prediction of outcomes in sepsis when added together (HbA1C+ SOFA score). There are no previous studies which have combined these two scores, to our knowledge.
In our study, we have given a score to HbA1c value of each patient and have added to SOFA score at their presentation and Max SOFA score during hospitalization and respectively have calculated two new scores by terms H-SOFA (HbA1c score + SOFA score at presentation) and H-SOFA max (HbA1c score + Max SOFA score during hospitalization). 59 patients who had given consent for HbA1c were analyzed and both H-SOFA and H-SOFA max were calculated for all these patients. A mean H-SOFA and mean H-SOFA max were calculated.
Mean H-SOFA was 7.64±3.37 for non-survivors compared to 5.49±2.68 in survivors with a significant difference in two groups in terms of H-SOFA Score (t=2.189, p=0.042). Mean H-SOFA max 12.21±2.78 in non-survivors when compared to 5.49±2.68 in survivors with a significant difference among two groups in terms of H-SOFA max (t=7.978, p=0.000) with the H-SOFA max being significantly higher in non-survivors group.
AUROC curves showed an AUC of 0.722 with a sensitivity of 71.4% and specificity of 71.1% for H-SOFA score and AUC of 0.953 with a sensitivity of 100% and specificity of 82.2% for H-SOFA max scores. In our study all three scores including SOFA, H-SOFA and H-SOFA max showed good correlation with mortality. H-SOFA is comparable to SOFA (Z= -0.167, p=0.864). H-SOFA max score was better than SOFA score (Z=-3.661, p <0.001) and H-SOFA score (Z= -0.3568, p<0.001) for predicting mortality.
Studies have also analyzed a relation of length of ICU stay with outcome of a patient. Jain et al in their study showed no significant correlation of length of ICU stay to the outcome of the patient [8]. However, in another study by Juhasz et al, there was a significant positive correlation between length of hospital stay and HbA1c in patients with sepsis [13]. In our study we analyzed correlation between critical care scoring systems with length of ICU stay, which showed no correlation of HbA1c alone, but a significant positive correlation of SOFA, H-SOFA and H-SOFA max with length of ICU stay, with the strength of association being best for H-SOFA max followed by H-SOFA and SOFA scores.
Limitations
Several limitations of the present study should be considered when interpreting the results. First, this was a single-center study. Second, the sample size was small, and this limitation may have caused bias in statistics. Despite our significant correlations, enrolment of a larger population might increase the statistical power.
Conclusion
Overall, patients who died had higher SOFA scores than those who survived and got discharged. H-SOFA max score (HbA1c score added to maximum SOFA measured on any day of hospital stay) was the best predictor for in-hospital mortality. Next best predictor was H-SOFA score (HbA1c score added to SOFA score at admission), followed by SOFA score. All the scores had a positive correlation with length of ICU stay. These scores may therefore be helpful to physicians and intensivists for prognostication of the patient and during counselling of the relatives, including end of life discussions. HbA1c (indicator of glycemic control) was helpful in predicting mortality when combined with the SOFA score (but not by itself). There are very few studies correlating HbA1c with mortality. Our study is the first one, to our knowledge, which has combined HbA1c and SOFA score in predicting outcomes in patients with sepsis and septic shock.
Conflicts of interest
Authors declare no conflicts of interest.
References
[1] Singer M, Deutschman CS, Seymour CW, Shankar-Hari M, Annane D, et al. The third international consensus definitions for sepsis and septic shock (Sepsis-3). JAMA. 2016; 315(8):801–810.
[2] Lambden S, Laterre PF, Levy MM, Francois B. The SOFA score—development, utility and challenges of accurate assessment in clinical trials. Crit Care. 2019; 23(1):374.
[3] Ferreira FL, Bota DP, Bross A, Mélot C, Vincent J. Serial Evaluation of the SOFA Score to predict outcome in critically ill Patients. JAMA. 2001; 286(14):1754–1758.
[4] Gupta V, Karnik ND, Agrawal D. SOFA score and critically ill elderly patients. J Assoc Physicians India. 2017; 65(7):47–50.
[5] Ravi K, Vinay K, Rao AK. Study of spectrum of sepsis and prediction of its outcome in patients admitted to ICU using different scoring systems. Int J Adv Med. 2019; 6:155–159.
[6] Qiao Q, Lu G, Li M, Shen Y, Xu D. Prediction of outcome in critically ill elderly patients using APACHE II and SOFA Scores. J Int Med Res. 2012; 40(3):1114–1121.
[7] Jain A, Palta S, Saroa R, Palta A, Sama S, Sequential organ failure assessment scoring and prediction of patient’s outcome in intensive care unit of a tertiary care hospital. J Anaesthesiol Clin Pharmacol. 2016; 32(3):364.
[8] Ivan G, Gornik O, Gasparović V. HbA1c is outcome predictor in diabetic patients with sepsis. Diabetes Res Clin Pract. 2007; 77(1):120–125.
[9] Sander M, Fickler J, Neddermeyer U, Delius SV, Budweiser S. Predictive Value of HbA1c-levels with regard to in-hospital mortality, length of hospital stay and intensive care utilisation versus different emergency risk scores and the Manchester triage system in unselected medical emergency admissions. Signa Vitae. 2020; 16(1):39–45.
[10] Fuchs PA, Czech IJ, Krzych ŁJ. Mortality prediction using SOFA score in critically ill surgical and non-surgical patients: which parameter is the most valuable? Medicina (Kaunas). 2020; 56(6):273.
[11] Raith EP, Udy AA, Bailey M, McGloughlin S, MacIsaac C, et al. Australian and New Zealand Intensive Care Society (ANZICS) Centre for Outcomes and Resource Evaluation (CORE). Prognostic Accuracy of the SOFA Score, SIRS Criteria, and qSOFA Score for In-Hospital Mortality Among Adults with Suspected Infection Admitted to the Intensive Care Unit. JAMA. 2017; 317(3):290–300.
[12] Lee YS, Min KH, Lee SY, Shim JJ, Kang KH, et al. The value of glycated hemoglobin as predictor of organ dysfunction in patients with sepsis. PLoS One. 2019; 14(5): e0216397.
[13] Juhász I, Juhász J, Lörincz H, Seres I, Végh L, et al. The potential diagnostic and predictive role of HbA1c in diabetic, septic patients: A retrospective single-center study. Emerg Med Int. 2022; 2022:8543232.