Full Text
Introduction
Corona virus disease (COVID-19) is an infectious disease caused by the severe acute respiratory syndrome–related corona virus 2 (SARS-CoV-2) [1-3]. Most of the infected people experience with mild to moderate respiratory illness and recovering without any special treatment. However, some of the infected patients became seriously ill and required medical attention. Aged people and people with co-morbid conditions like chronic respiratory disease, cardiovascular disease, diabetes, or cancer are more likely to develop serious illness [4].
Worldwide pandemic situation was declared by World Health Organization (WHO) on 11th March 2020 [5]. Globally, 510,270,667 confirmed COVID-19 cases including 6,233,526 deaths reported to WHO as of 29 April 2022. Total of 11,477,767,378 vaccine doses have been administered as of 26 April 2022 [6]. In India, there have been 43,072,176 confirmed cases for COVID-19 infection with 523,753 deaths reported to WHO from 3 January 2020 to 29 April 2022. Total of 1,881,699,433 vaccine doses have been administered as of 25 April 2022 [7]. Most of the vaccinated peoples re-infected with COVID-19 because of genome mutation of the virus.
In August 2020, our college became as a reference COVID-19 Surveillance Testing Centre for Siddipet district, Telangana. As per our observation we received lot of covid-19 suspected samples in the month of September 2020 during 1st wave, May 2021 during 2nd wave and Jan 2022 during 3rd wave. In the present study, we extended the sample collection period during 1st, 2nd and 3rd wave of COVID-19 pandemic situations, which occurred from Mar 2020 to Mar 2022. Therefore, the aim of the study was to test, analyze and compare the frequency of COVID-19 infection to identify which age group is more likely infected with COVID-19 in respected pandemic situations. So, this analysis could be useful to sensitize the population. Hence, the major objectives of the study are to identify the frequency of the COVID-19 infection, to found gender wise infection rate and to recognize the age group more likely infected with COVID-19 virus during outbreaks.
Materials and methods
As we know the COVID-19 pandemic situation in India has been started from Feb 2020 as we call it as a 1st wave, but laboratory started at Government Medical College (GMC), Siddipet in the month of August 2020 to test the COVID-19 in the rural areas for surveillance. So, we were presenting the data from Aug 2020 to Mar 2021 as a 1st wave, from Apr 2021 to Nov 2021 as a 2nd wave and from Dec 2021 to Mar 2022 as a 3rd wave. Ethical committee approval has been taken for this study.
Sample collection
Total of 67,165 (14,905 samples during 1st wave {Aug 2020 to Mar 2021}, 33652 samples during 2nd wave {Apr 2020 to Nov 2021} and 18,608 samples during 3rd wave {Dec 2021 to Mar 2022}) Nasopharyngeal swab samples collected at Government General Hospital (GGH), Siddipet and Primary Healthcare Centres (PHCs) of all over the Siddipet district, Telangana, India. The following sample collection procedure followed to collect the samples briefly, sample collecting technician has worn PPE kit as per the WHO guidelines. Viral Transport Media (VTM) tube has been labeled with respected subject name and registration number. Asked the subject to take off his/her mask and blow his/her nose into a tissue to clear excess secretions from the nasal passages. Swab removed from the test kit package. COVID-19 suspected subject head slightly tilted back, so that we can access the nasal passages. Swab inserted along the nasal septum to the nasopharynx. As per the Centers for Disease Control and Prevention (CDC) recommendations swab was left in place for 2-5 seconds to absorb secretions and then slowly removed the swab while rotating it. After sample collection, asked the subject to reapply his/her mask. Once sample collected at PHCs and GGH, it got packed in ziplock covers and placed in the vacuum carrier (maintained 4°C) transferred to GMC, Siddipet.
VTMs got re-checked with list of samples sent by respected PHCs and GGH at Department of Virus Research and Molecular Diagnostics (DVRMD) lab, GMC, Siddipet and preceded to RNA Isolation.
Isolation of RNA
Total RNA extracted with MagRNA - II Viral RNA Extraction Kit (Genes2me) by using Automated RNA Extractor (KingFisher™ Flex Purification System, KingFisher with 96 Deep-well Head, ThermoFisher Scientific) with the following procedure. Prepared deep well plates with supplied buffers as follows, Plate 1 filled with 450μL Buffer MLB in each well of 96 well plate followed by 200μL sample, 20μL MagPure particles MPN and 22μL of proteinase K & carrier RNA mix. Plate 2 filled with 100μL buffer AVE in each well. Plate 3 filled with 500µL buffer MW1 in each well. Plate 4 filled with 500µL buffer MW2 in each well. Turned on the machine (Automated RNA Extractor), placed the pre-filled cartridges at defined workstations and started the corresponding program. Completed the programme in ∼30 minutes, removed the plates and preceded the elution plate to RT-qPCR.
Real-time quantitative polymerase chain reaction (RT-qPCR)
Qualitative testing for SARS-CoV2 identification has been done with Genes2me viral detect-II multiplex real time COVID-19 PCR kit by using Insta Q96™ Real Time Machine (HiMedia). qPCR setup has been done on ice plate as follows: 10 µL of 2x OneStepMasterMix, 1µL of target primer probe mix (E, RdRp, N and RNAseP) and 9µL of sample RNA added to each well of 96 well plate and kept negative and positive control as per the kit manufacturer protocol. Fluorescence channel setting done for the E gene (Reporter: FAM, Quencher: None), RdRp gene (Reporter: Texas Red, Quencher: None), N gene (Reporter: Cy5, Quencher: None) and Internal Control RNaseP gene (Reporter: HEX, Quencher: None). Cycling protocol has been used for run the protocol as follows 1 cycle of 55°C for 10minutes, 95°C for 3minutes and 40 cycles of 95°C for 15 seconds, 60°C for 1minute. Once completed the protocol run, Ct values noted and <35 Ct considered for positive and >35 is considered as negative as per the manufacturer protocol.
Results
The distribution of COVID-19 suspected cases among all three waves presented in Tables 1, 2 & 3. From Aug 2020 to Mar 2022, 12311 (18.32%) tested positive among a total of 67165 samples. Among these, 3550 tested positive during 1st wave (5.28% of the overall COVID-19 cases during the three waves and 23.81% of the total of 14905 during 1st wave), 5697 tested positive during 2nd wave (8.48 % of the overall COVID-19 cases during the three waves and 16.93% of the total of 33652 during 2nd wave) and 3064 samples tested positive during 3rd wave (4.56% of the overall COVID-19 cases during the three waves and 16.46% of the total of 18608 during 3rd wave).
Table 1: Age and sex distribution of all subjects tested during 1st wave.
|
Age groups (years)
|
Males
|
Females
|
Total
|
|
≤5
|
166
|
155
|
321
|
|
6-20
|
1710
|
1377
|
3087
|
|
21-40
|
2055
|
1727
|
3782
|
|
41-60
|
1135
|
605
|
1740
|
|
≥61
|
4435
|
1540
|
5975
|
|
Total
|
9501
|
5404
|
14905
|
Table 2: Age and sex distribution of all subjects tested during 2nd wave.
|
Age groups (years)
|
Males
|
Females
|
Total
|
|
≤5
|
198
|
198
|
396
|
|
6-20
|
2584
|
2681
|
5265
|
|
21-40
|
11028
|
7069
|
18097
|
|
41-60
|
4994
|
3067
|
8061
|
|
≥61
|
1106
|
727
|
1833
|
|
Total
|
19910
|
13742
|
33652
|
Table 3: Age and sex distribution of all subjects tested during 3rd wave.
|
Age groups (years)
|
Males
|
Females
|
Total
|
|
≤5
|
97
|
73
|
170
|
|
6-20
|
2172
|
1969
|
4141
|
|
21-40
|
5359
|
3795
|
9154
|
|
41-60
|
2518
|
1638
|
4156
|
|
≥61
|
591
|
396
|
987
|
|
Total
|
10737
|
7871
|
18608
|
The highest frequency of COVID-19 cases was observed during 1st wave from Aug 2020 to Mar 2021 and lowest frequency observed during 3rd wave from Dec 2021 to Mar 2022. Interestingly, high number of tests done during 2nd wave even though positive percentage is lower than 1st wave (Tables 3-6).
Table 4: Age range percentage of COVID-19 patients during 1st wave.
|
Age groups (years)
|
COVID-19 Positive cases
|
Positive %
|
|
Male
|
Female
|
Total (Tested)
|
|
≤5
|
122
|
26
|
148
|
1
|
|
6-20
|
299
|
169
|
468
|
3.14
|
|
21-40
|
1116
|
546
|
1662
|
11.15
|
|
41-60
|
684
|
308
|
992
|
6.65
|
|
≥61
|
120
|
160
|
280
|
1.87
|
|
Total
|
2341
|
1209
|
3550 (14905)
|
23.81
|
Table 5: Age range percentage of COVID-19 patients during 2nd wave.
|
Age groups (years)
|
COVID-19 Positive cases
|
Positive %
|
|
Male
|
Female
|
Total (Tested)
|
|
≤5
|
27
|
18
|
45
|
0.13
|
|
6-20
|
358
|
308
|
666
|
1.98
|
|
21-40
|
2080
|
1131
|
3211
|
9.54
|
|
41-60
|
902
|
527
|
1429
|
4.25
|
|
≥61
|
199
|
147
|
346
|
1.03
|
|
Total
|
3566
|
2131
|
5697
|
16.93
|
Table 6: Age range percentage of COVID-19 patients during 3rd wave.
|
Age groups (years)
|
COVID-19 Positive cases
|
Positive %
|
|
Male
|
Female
|
Total (Tested)
|
|
≤5
|
24
|
21
|
45 (170)
|
0.24
|
|
6-20
|
357
|
203
|
560 (4141)
|
3.01
|
|
21-40
|
1041
|
565
|
1606 (9154)
|
8.63
|
|
41-60
|
449
|
242
|
691 (4156)
|
3.71
|
|
≥61
|
97
|
65
|
162 (987)
|
0.87
|
|
Total
|
1968
|
1096
|
3064 (18608)
|
16.46
|
Out off 14905 samples during 1st wave 3550 (23.81%) subjects were detected for COVID-19 infection, in that 2341 (15.70%) were males and 1209 (8.11%) were females (Table 7). During 2nd wave out off 33652 samples 5697 (16.93%) subjects infected with COVID-19, in that 3566 (10.60%) were males and 2131 (6.33%) were females (Table 8) and during 3rd wave out off 18,608 samples 3064 (16.46%) subjects infected with COVID-19, in that 1968 (10.57%) were males and 1096 (5.89%) were females (Table 9).
Table 7: Positive percentage of COVID-19 cases during 1st wave.
|
Gender
|
No. of subjects tested
|
COVID-19 positive cases
|
Positive %
|
|
Males
|
9501
|
2341
|
15.7
|
|
Females
|
5404
|
1209
|
8.11
|
|
Total
|
14905
|
3550
|
23.81
|
Table 8: Positive percentage of COVID-19 cases during 2nd wave.
|
Gender
|
No. of Subjects tested
|
COVID-19 positive cases
|
Positive %
|
|
Males
|
19910
|
3566
|
10.6
|
|
Females
|
13742
|
2131
|
6.33
|
|
Total
|
33652
|
5697
|
16.93
|
Table 9: Positive percentage of COVID-19 cases during 3rd wave.
|
Gender
|
No. of subjects tested
|
COVID-19 positive cases
|
Positive %
|
|
Males
|
10737
|
1968
|
10.57
|
|
Females
|
7871
|
1096
|
5.89
|
|
Total
|
18608
|
3064
|
16.46
|
During 1st wave younger age people were infected more compared to 2nd and 3rd wave. In all three waves, the risk of the infection increased consistently till 40 yrs age and then decreased in older age groups. People aged ≥60 years were lower risk of infection compared to younger age groups. When we compared all the three waves in ≤5years group rate of infection spontaneously decreased from 1st wave (1%) to 2nd wave (0.13%) and slightly increased in 3rd wave (0.24%). In age group 6-20years rate of infection high in 1st wave (3.14%), decreased in 2nd wave (1.98%) and again increased in 3rd wave (3.01%). As per our data younger age group people were infected more compared all the age groups at all the time points (Table 10).
Table 10: Comparison age range percentage of COVID-19 patients between 1st, 2nd and 3rd wave.
|
Age groups
(years)
|
1st Wave
(Aug 2020 to Mar 2021)
|
2nd Wave
(Apr 2021 to Nov 2021)
|
3rd Wave
(Dec 2021 to Mar 2022)
|
|
No. of subjects tested
|
No. of positive cases
|
Positive %
|
No. of subjects tested
|
No. of positive cases
|
Positive %
|
No. of subjects tested
|
No. of positive cases
|
Positive %
|
|
≤5
|
321
|
148
|
1
|
396
|
45
|
0.13
|
170
|
45
|
0.24
|
|
6-20
|
3087
|
468
|
3.14
|
5265
|
666
|
1.98
|
4141
|
560
|
3.01
|
|
21-40
|
3782
|
1662
|
11.15
|
18097
|
3211
|
9.54
|
9154
|
1606
|
8.63
|
|
41-60
|
1740
|
992
|
6.65
|
8061
|
1429
|
4.25
|
4156
|
691
|
3.71
|
|
≥61
|
5975
|
280
|
1.87
|
1833
|
346
|
1.03
|
987
|
162
|
0.87
|
|
Total
|
14905
|
3550
|
23.81
|
33652
|
5697
|
16.93
|
18608
|
3064
|
16.46
|
All three time points males were predominantly infected with SARS-CoV2 compare to females. And also 21-40 age group subjects were highly infected in all three time points 1st wave (11.15%), 2nd wave (9.54%) and 3rd wave (8.63%). When we compare the results, high positive cases detected for 1st wave in the month of Sep-2020, for 2nd wave in the month of May-2021 and for 3rd wave in the month of Jan-2022 (Figure 1).
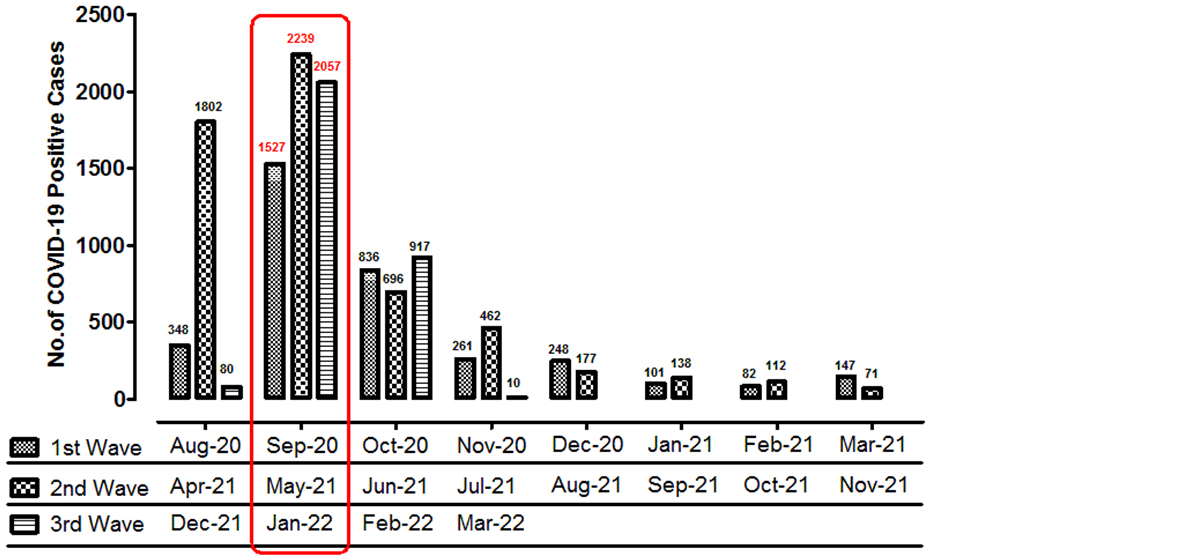
Figure 1: Showing COVID-19 positive cases; high positive rate observed in Sep-2020 for 1st wave, May-2021 for 2nd wave and Jan-2022 for 3rd wave.
Discussion
The overall positive percentage among all three waves is 18.32% in suspected COVID-19 cases from Aug 2020 to Mar 2022 in rural areas surround to Siddipet district, Telangana. The very low infection rate observed during 3rd wave. Fewer compared studies have been published on SARS-CoV-2 infection during the 1st, 2nd, and 3rd waves [8]. One of the recent study on health care workers saying that working in COVID-19 laboratory ass designated positions were not in a risk category for COVID-19 infection. But, correct use of personal protective equipment and personnel caring is very important to prevent the infection [9]. One more study compared the 1st wave and 2nd wave data on haemodialysis patients saying that risk of death of dialysis patients remains unchanged between the first and second outbreaks and suggested that vulnerable patient group needs to be prioritized for interventions to prevent severe COVID-19 includes vaccination [10]. Unfortunately, our study has a major limitation that being in a government sector we won’t have a choice to follow-up with the patient history and disease condition due to heavy sample load during outbreaks. So, our data has focused general comparison between outbreaks to know the infection status and age group comparisons. Safety measure specific to COVID-19 are strictly needed to co-morbid conditioned patients as well as common people, all the members should maintain the social distance and regular hand wash needed and also awareness programmes were needed for the society to prevent infection. As per the literature older age people are highly infected during 1st wave, but our data is showing that the adult age group is more infected compared to older age group (Table 4). Similar comparison was observed during the 2nd wave adult age group was highly infected than others [11, 12].
Our study discovered that the most of the population around Siddipet district remains susceptible to infection during 2nd month of the first, second and third wave. After a month drastically it got reduced and comparatively qualitative prevalence getting significantly decreased from first (23.81%) to third (16.46%) wave. This variation can be attributed to samples collected from different places of sample collection, including urban (GGH) and rural (PHC) centers. Expecting that primarily wave starting in major cities of the country and slowly it is moving to districts and rural areas. Infection rate is low in villages; because of people are living in unpolluted air and working in spacious places, indirectly maintain the social distancing.
Previous studies revealed that the infection rate is high in old age subjects, but we found that the age is not significantly associated with positive rate. In all three time points adult age group subjects were predominantly infected because they usually come out for the work and visited cities even though in lockdown crises. We found male subjects were more infected than females. National survey showed that male subjects highly infected than females [13], our study also proved that. COVID-19 infectivity can be influenced by mobility rather than age and gender, as per our data high number of young age peoples were infected than others, because this category of peoples came out from house for work and home needs to survive their family members even though in lockdowns.
Conclusion
Our study showed the importance of studying SARS-CoV-2 infection during all the three pandemic waves in rural areas surrounding to Siddipet district, Telangana people exposed to the virus. As per our data all over infection rate during three pandemic situations is 18.32%, and also found that males (11.72%) were predominantly infected than females (6.60%) during all the three waves. Age range analysis showed that, adult age people (21-40) were highly infected followed by 41-60yrs, 6-20yrs, ≥60yrs and ≤5yrs. All the age categories were more likely infected during 1st wave compared 2nd and 3rd wave, this reduction may be because of vaccine availability and awareness to COVID-19 infection from 2nd wave.
Acknowledgements
We are thankful to Indian Council of Medical Research (ICMR), New Delhi for their kind support to approve the COIVD-19 testing process and quality management. Special thanks to Dr. Tamil Arasi (Director, GMC) and Dr. Chandrashekhar (OSD, GMC) for supporting to establish laboratory and the laboratory staff for completing the study.
Conflict of interest
The authors declare that they have no conflict of interest.
References
[1] Cui J, Li F, Shi ZL. Origin and evolution of pathogenic coronaviruses. Nat Rev Microbiol. 2019; 17(3):181–192.
[2] Wu JT, Leung K, Leung GM. Nowcasting and forecasting the potential domestic and international spread of the 2019-nCoV outbreak originating in Wuhan, China: a modelling study. Lancet. 2020; 395(10225):689–697.
[3] Hui DS, Azhar EI, Madani TA, Ntoumi F, Kock R, et al. The continuing 2019-nCoV epidemic threat of novel coronaviruses to global health - The latest 2019 novel coronavirus outbreak in Wuhan, China. Int J Infect Dis. 2020; 91:264–266.
[4] Deng SQ, Peng HJ. Characteristics of and Public health responses to the coronavirus disease 2019 outbreak in China. J Clin Med. 2020; 9(2):575. [5] WHO characterizes COVID-19 as Pandemic 2019. Accessed on 11 Mar 2020 from https://www.who.int/emergencies/diseases/novel-coronavirus-2019/events-as-they-happen
[6] WHO Global (2022). Accessed from: https://covid19.who.int/
[7] WHO India (2022). Accessed from: https://covid19.who.int/region/searo/country/in
[8] Tacconi F, Rogliani P, Leonardis F, Sarmati L, Fabbi E, et al. Incidence of pneumomediastinum in COVID-19: A single-center comparison between 1st and 2nd wave. Respir Investig. 2021; 59(5):661–665.
[9] De Maria L, Sponselli S, Caputi A, Pipoli A, Giannelli G, et al. Comparison of Three Different Waves in Healthcare Workers during the COVID-19 Pandemic: A Retrospective Observational Study in an Italian University Hospital. J Clin Med. 2022; 11(11):3074.
[10] Savino M, Santhakumaran S, Currie CSM, Onggo BSS, Evans KM, et al. Comparison of outcomes of in-centre haemodialysis patients between the 1st and 2nd COVID-19 outbreak in England, Wales, and Northern Ireland: A UK Renal Registry Analysis. Nephron. 2022; 146(5):469–480.
[11] Hippich M, Sifft P, Zapardiel-Gonzalo J, Böhmer MM, Lampasona V, et al. A public health antibody screening indicates a marked increase of SARS-CoV-2 exposure rate in children during the second wave. Med (NY). 2021; 2(5): 571–572.
[12] Jalali SF, Ghassemzadeh M, Mouodi S, Javanian M, Kani MA, et al. Epidemiologic comparison of the first and second waves of coronavirus disease in Babol, North of Iran. Caspian J Intern Med. 2020; 11(Suppl 1):544–550.
[13] Murhekar MV, Bhatnagar T, Selvaraju S, Rade K, Saravanakumar V, et al. Prevalence of SARS-CoV-2 infection in India: Findings from the national serosurvey, May-June 2020. Indian J Med Res. 2020; 152(1&2):48–60.