Orginal Research
2022
December
Volume : 10
Issue : 4
Prognostic value of neutrophil to lymphocyte ratio in infection with COVID-19 virus - A retrospective study
Rakshitha HB, Sanjay M, Pravallika J
Pdf Page Numbers :- 226-230
Rakshitha HB1, Sanjay M1,*, and Jalli Pravallika1
1Department of Pathology, Adichunchanagiri Institute of Medical Sciences, Adichunchanagiri University, B.G Nagara, Mandya-571418, Karnataka, India
*Corresponding author: Dr. Sanjay M, Associate Professor, Department of Pathology, Adichunchanagiri Institute of Medical Sciences, Adichunchanagiri University, B.G Nagara, Mandya-571418, Karnataka, India. Email: sanjay.mysore82@gmail.com
Received 8 July 2022; Revised 22 August 2022; Accepted 2 September 2022; Published 14 September 2022
Citation: Rakshitha HB, Sanjay M, Pravallika J. Prognostic value of neutrophil to lymphocyte ratio in infection with COVID-19 virus - A retrospective study. J Med Sci Res. 2022; 10(4):226-230. DOI: http://dx.doi.org/10.17727/JMSR.2022/10-42
Copyright: © 2022 Rakshitha HB et al. Published by KIMS Foundation and Research Center. This is an open-access article distributed under the terms of the Creative Commons Attribution License, which permits unrestricted use, distribution, and reproduction in any medium, provided the original author and source are credited.
Abstract
Background: The spread of COVID-19 infection paved way to many admissions into hospitals worldwide exhausting the healthcare systems. A simple test for immediate stratification of risk in patients with infection by COVID 19 virus is important. Aim in this study was to know the prognostic value of neutrophil to lymphocyte ratio (NLR) in determination of the severity of infection in COVID-19 infected patients.
Methods: This study was conducted in a tertiary care institute, Mandya. Clearance from Institutional Ethical committee was taken. Data from 108 COVID-19 infected hospitalized patients between April 2021 and June 2021 were collected retrospectively from hospital records. Patients in the study were grouped into two groups as Intensive Care Unit (ICU) and Ward (Non ICU) patients, based on admission into ICU. The patient’s demographic characteristics, comorbidities, clinical manifestations, medications used and investigations done initially during admission were noted from the hospital files for both groups. Chi-square test/ Fisher's exact test was used for comparison of categorical outcomes. Statistical significance was noted if P value < 0.05.
Results: Of 108 patients, 25 patients (23.15%) had ICU admission. Patients aged >55years had more ICU admission (44%) than non-ICU admissions (22.89%). In patients <55years non-ICU admissions were more (77.11%) compared to ICU admissions (56%). Leukocytosis, neutrophilia, lymphopenia, high CRP values were seen more in patients in ICU than in ward and is significant statistically (p <0.05). High NLR values were seen in patients in ICU than in ward. Chi-square test is significant (p < 0.05).
Conclusion: Increased NLR predicts the severity of infection in patients infected with COVID-19 virus, who will require admission into ICUs. It can be used as a biomarker which can aid in identifying severe COVID 19 infection.
Keywords: COVID-19; neutrophil to lymphocyte ratio; D-dimer; prognostic biomarkers
Full Text
Background
Coronavirus infection was identified in Wuhan city in China. This disease affects the respiratory system leading to severe acute respiratory infections. This disease was named as Coronavirus disease 2019 (COVID-19) by World Health Organization (WHO) on 12th January 2020 [1-3]. This disease is known to spread directly to humans through droplet, human-to-human transmission and also indirectly through contaminated objects [2].
During treatment, while most of the patients had favorable outcomes, some deteriorated rapidly and developed complications like respiratory distress syndrome, coagulation dysfunction, multi-organ failure, etc. Patients prone to deteriorate must be identified early so that immediate intervention and management could be done.
NLR is derived by dividing the count of neutrophils by the count of lymphocytes. It is a marker of inflammatory response. In diseases like pneumonia, acute respiratory distress syndrome, solid tumors it has prognostic value also [4]. Various studies in the past have reported that in COVID 19 infection changes in a few biochemical and hemocytometric markers such as count of lymphocytes, interleukin-6 (IL-6), NLR, D-dimer and C-reactive protein (CRP) can predict the severity of infection and hence can be used as markers for prognosis [1, 5, 6, 7-10].
But similar studies regarding this in South Asia is limited. This study aims to analyze value of NLR in patients having COVID 19 infection which helps in determination of severity of infection in a South Indian setting.
The aim of the study was determination of NLR values in patients with infection by COVID 19 virus (both ICU and ward patients) and comparison of NLR values between ICU and ward patients.
Methods
This study was done retrospectively in a tertiary care institute, Mandya. Clearance from Institutional Ethical committee was taken. Data from 108 hospitalized patients between April 2021 and September 2021, who were diagnosed with COVID-19 infection were collected retrospectively from hospital records. Based on where the patients were initially admitted, they were divided into two groups, Intensive Care Unit (ICU) admitted and non-ICU admitted patients. All hematology investigations done at the time of admission were recorded.
Statistical methods
To assess normal distribution Shapiro-wilk test was used. Normal distribution was considered with p-value of > 0.05. Independent sample t-test (2 groups) was used for normally distributed quantitative parameters and Mann Whitney u test (2 groups) was used for non-normally distributed Quantitative parameters, an appropriate post-hoc test (LSD/ Bonferroni) was used if ANOVA showed a significant difference for pairwise comparisons. Chi-square test/ Fisher's exact test was used for comparison of categorical outcomes. Statistical significance was noted if P value < 0.05. 22 Version of SPSS software was used to analyze the data.
Results
A total of 108 patients were included in the study. Out of 108 patients, 25 patients (23.15%) had ICU admissions and 83 patients (76.85%) had non ICU (ward) admissions (Figure 1). In patients older than 55 years, ICU admissions were more than non-ICU admissions (Table 1).
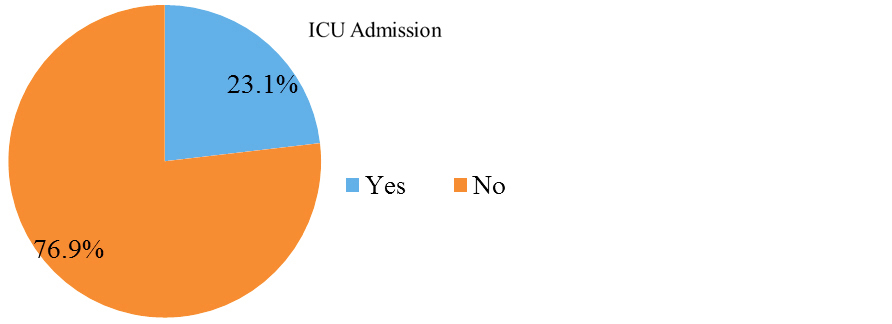
Figure 1: Pie chart of ICU and Non-ICU admission in the study population (N=108).
Table 1: Comparison of age distribution among patients in ICU and non ICU (N=108).
|
Age
|
ICU Admission
|
Chi square
|
P value
|
|
Yes (N=25)
|
No (N=83)
|
|
<55 Years
|
14 (56%)
|
64 (77.11%)
|
4.267
|
0.039
|
|
>=55 Years
|
11 (44%)
|
19 (22.89%)
|
Male patients required more ICU admissions compared to females and it was statistically not significant (Table 2).
Table 2: Comparison of gender distribution among patients in ICU and non-ICU (N=108).
|
Gender
|
ICU Admission
|
Chi square
|
P value
|
|
Yes (N=25)
|
No (N=83)
|
|
Male
|
17 (68%)
|
54 (65.06%)
|
0.074
|
0.786
|
|
Female
|
8 (32%)
|
29 (34.94%)
|
Patients with COVID 19 infection presented with various symptoms like fever, body pain, headache, breathlessness, vomiting, cough and easy fatigability. Most common symptom in ICU admitted patients was breathlessness (64%), followed by cough (56%), fever (52%), where as in non-ICU patients, cough (77.1%) was the common symptom followed by fever (73.4 %), breathlessness (38.5%) (Table 3).
Table 3: Comparing symptoms between patients in ICU and ward (N=108).
|
Presenting symptoms
|
ICU admission
|
P value
|
|
Yes (N=25)
|
No (N=83)
|
|
Fever
|
13 (52%)
|
61 (73.49%)
|
0.043*
|
|
Body pain
|
1 (4%)
|
0 (0%)
|
†
|
|
Headache
|
1 (4%)
|
3 (3.61%)
|
1.000‡
|
|
Breathlessness
|
16 (64%)
|
32 (38.55%)
|
0.025*
|
|
Vomiting
|
0 (0%)
|
3 (3.61%)
|
†
|
|
Cough
|
14 (56%)
|
64 (77.11%)
|
0.039*
|
|
Easy Fatigability
|
2 (8%)
|
3 (3.61%)
|
0.327‡
|
Abbreviations: *: Chi square test, ‡: Fisher exact test, †: No statistical test was applied- due to 0 subjects in the cells.
Comorbidities like hypertension, diabetes mellitus, epilepsy, hypothyroidism, ischemic heart disease and pulmonary tuberculosis were seen in patients in our study. Comorbidities were commonly seen in patients in ICU compared to non ICU. Among ICU patients 32% had hypertension and 20% had diabetes mellitus (Table 4).
Table 4: Comparing comorbidities between patients in ICU and ward (N=108).
|
Comorbidities
|
ICU Admission
|
P value
|
|
Yes (N=25)
|
No (N=83)
|
|
Hypertension
|
8 (32%)
|
8 (9.64%)
|
0.010*
|
|
Diabetes
|
5 (20%)
|
11 (13.25%)
|
0.520*
|
|
Epilepsy
|
0 (0%)
|
1 (1.2%)
|
†
|
|
Hypothyroid
|
0 (0%)
|
1 (1.2%)
|
|
K/C/O IHD
|
0 (0%)
|
1 (1.2%)
|
|
Pregnant
|
0 (0%)
|
1 (1.2%)
|
|
PTB
|
0 (0%)
|
1 (1.2%)
|
|
Total
|
25 (100%)
|
78 (93.98%)
|
Abbreviations: *: Fisher exact test, †: No statistical test was applied- due to 0 subjects in the cells.
Comparison of various blood investigations were done between patients admitted in ICU and non-ICU wards. Hemoglobin levels, sedimentation rate of erythrocytes, count of red cells, count of platelets, packed cell volume, RBC indices, red cell distribution width (RDW), PT, APTT and LDH values showed no statistical significance between patients in ICU and ward. Total WBC count was more in patients in ICU than in wards. Neutrophilia, lymphopenia was noted more in patients in ICU than in ward and were significant statistically. Patients in ICU had elevated C reactive protein levels than in ward patients, and is statistically significant. N/L ratio was elevated in patients in ICU than in ward and showed statistical significance (p<0.003) (Table 5).
Table 5: Comparing various investigation parameters between the two groups (N=108).
|
|
ICU admission
|
Mann Whitney U test (P value)
|
|
Yes
Median (IQR)
|
No
Median (IQR)
|
|
SPO2 @RA (N=108)
|
82 (65.5,90)
|
92 (87,95)
|
<0.001
|
|
HB (N=108)
|
13.89 (12.2,15.15)
|
14.1 (12.5,15.4)
|
0.779
|
|
TC (N=108)
|
8690 (6790,16340)
|
7570 (5670,9160)
|
0.010
|
|
N (N=108)
|
86 (76.5,90)
|
80 (71,86)
|
0.008
|
|
L (N=108)
|
10 (8,17.5)
|
18 (10,23)
|
0.010
|
|
E (N=108)
|
0 (0,0)
|
0 (0,1)
|
0.070
|
|
M (N=108)
|
2 (1.5,3)
|
3 (2,4)
|
0.128
|
|
B (N=108)
|
0 (0,0)
|
0 (0,0)
|
1.000
|
|
ESR (N=108)
|
12 (9.5,21)
|
10 (7,15)
|
0.140
|
|
RBC (N=108)
|
4.54 (4.41,5.07)
|
4.73 (4.4,5.21)
|
0.951
|
|
PLT (N=108)
|
2.54 (2.02,3.15)
|
2.1 (1.56,2.68)
|
0.116
|
|
PCV (N=108)
|
41.03 (36.2,44.35)
|
41.1 (36.3,44.8)
|
0.971
|
|
MCV (N=108)
|
84 (80.2,88.3)
|
85.4 (80.4,89.2)
|
0.710
|
|
MCH (N=108)
|
29.2 (26.9,30.07)
|
29.4 (27.4,30.6)
|
0.334
|
|
MCHC (N=108)
|
34.3 (33.45,34.6)
|
34.2 (33.7,34.6)
|
0.698
|
|
RDW (N=108)
|
11.8 (11.2,12.1)
|
12.11 (11,13.3)
|
0.111
|
|
MPV (N=108)
|
8.6 (8.15,9.25)
|
8.8 (8.5,9.4)
|
0.107
|
|
PT (N=108)
|
14 (13.4,14.85)
|
13.9 (13,14.8)
|
0.869
|
|
APTT (N=108)
|
31 (29,33)
|
30 (29,31)
|
0.129
|
|
LDH (N=108)
|
435 (248.5,626.5)
|
328 (226,436)
|
0.126
|
|
CRP (N=108)
|
12.80 (7.15,16.75)
|
8 (5.87,11.5)
|
0.028
|
|
N/L (N=105)
|
8.65 (5.6,11.25)
|
4.4 (3.2,8.75)
|
0.003
|
Patients with increased NLR during hospital admission time had more ICU admissions (66.6%) than non ICU admissions (35.8%), whereas patients with low NLR had more non ICU admissions (64.2%) than ICU admissions (33.3%). This was significant statistically (p 0.007) (Table 6).
Table 6: Comparison of N/L ratio in patients in ICU and non-ICU (N=108).
|
N/L
|
ICU Admission
|
Chi square
|
P value
|
|
Yes (N=25)
|
No (N=83)
|
|
High (>=6.55)
|
17 (68%)
|
31 (37.3%)
|
7.202
|
0.007
|
|
Low (<6.55)
|
8 (32%)
|
52 (62.6%)
|
Sensitivity and specificity of NLR in prediction of ICU admissions were 66.6% and 64.2% respectively (Table 7).
Table 7: Predictive validity of N/L in predicting ICU Admission (N=108).
|
Parameter
|
Value
|
95% CI
|
|
Lower
|
Upper
|
|
Sensitivity
|
66.67%
|
44.68%
|
84.37%
|
|
Specificity
|
64.20%
|
52.77%
|
74.55%
|
Discussion
108 patients were there in the study. Of total 108 patients, 83 (76.85%) were admitted in non -ICU wards and 25 (23.1%) were admitted in ICU (Figure 1). Patients aged more than 55 years had more ICU admissions (44%) than non-ICU admission (19%) whereas patients less than 55 years had more non-ICU admissions (77.1%) than ICU admissions (56%) which was significant statistically (p value 0.03) (Table-1). This result in our study is similar to Hashem et al where the mean age in the patients admitted in ICU was more than in Wards [11].
Male patients in our study had more ICU admissions than non-ICU admissions but this result was not statistically significant (Table 2). According to Hashem et al 58.6% of patients admitted in ICU were male patients [11].
As regarding the presenting symptoms, common symptoms in ICU patients were breathlessness (64%) followed by cough (56%), fever (52%), easy fatigability (8%), body ache (4%) and headache (4%) (Table 3). In non-ICU admitted patients commonest symptom was cough (77.1%) followed by fever (73.4%), breathlessness (38.5%), easy fatigability (3%), headache (3%) and vomiting (3%). Among these symptoms breathlessness, cough and fever had significant difference statistically between the two groups [p<0.05] (Table 3).
Hashem et al also found fever, cough, breathlessness to be common symptoms in the two groups but more in patients in ICU, whereas according to Imran et al cough, fever, breathlessness between the two groups did not have statistical significance [p>0.5] [11, 12]. Presence of comorbid diseases like hypertension (32%) and diabetes (20%) were more in patients in ICU than in ward (Table 4). This result was similar to Hashem et al who also found the presence of higher comorbid diseases in ICU patients [11].
In the present study, difference in hypertension prevalence between both the groups was significant (p 0.010) (Table 4) whereas according to Imran et al, the difference in diabetes prevalence was statistically significant [12].
Grasselli et al reported hypertension to be the most common comorbidity in their study [13]. A study in the United States among COVID-19 ICU admissions had similar findings [14]. As regards the laboratory investigations in this study, both the groups of patients showed a significant difference in the total count, neutrophil count, lymphocyte count, CRP, and N/L ratio. Other investigations like ESR, RBC count, RBC indices, PT, and APTT valves did not show any statistical significance (Table 6).
Some studies have suggested lymphopenia and leukocytosis as the hazard factors in COVID 19 infection [15, 16]. Lymphopenia may occur in severe COVID 19 disease due to direct infection of lymphocytes, lymphatic tissue destruction, apoptosis of lymphocytes due to metabolic abnormalities causing lymphocyte inhibition like lactic acidosis [17]. Number of lymphocytes in the body have a negative correlation with the degree of inflammation [6].
In this study, lymphopenia was present more in patients in ICU (p<0.001) [Table 6]. This result is similar to Hashem et al and Imran et al [11, 12]. The present study showed increased NLR at admission time to be a risk factor for severe COVID 19 disease responsible for ICU admissions. Few other studies had similar results [7, 18-20]. Normal range of NLR in adults is between 1.0 and 2-3 [18, 21]. In this study, NLR >6.5 was taken as cut off point to predict severe infection.
In COVID 19 infection, increase in the count of neutrophils indicates the degree of inflammatory response whereas decrease in the count of lymphocytes indicate the degree of immune balance [21]. NLR is a marker of the inflammatory response as it reflects the balance between the severity of inflammation and immunity status of the body [22].
Inflammatory response in severe COVID 19 disease will be more than in mild and moderate disease. As NLR is a marker of systemic inflammation, it will be increased in severe disease. This explains the significantly increased NLR seen in patients in ICU with severe COVID 19 infection in our study. Hence increasing NLR can be used as a marker to identify severe COVID 19 disease which requires ICU admission.
Limitations
The study has certain limitations like small sample size, and being a single center study.
Conclusion
Identification of severe cases of COVID 19 infection in the initial stages is very crucial so that the treatment can be started early which can thereby improve the disease prognosis. NLR is a marker of systemic inflammation which can be used to help in early identification of severe infections with COVID 19 which helps in its further management. It is a useful biomarker to predict the disease severity in resource-poor settings which lack radiological services and higher investigations.
Conflicts of interest
Authors declare no conflicts of interest.
References
[1] Ye W, Chen G, Li X, Lan X, Ji C, et al. Dynamic changes of D-dimer and neutrophil-lymphocyte count ratio as prognostic biomarkers in COVID-19. Respir Res. 2020; 21(1):169.
[2] Bal A, Agrawal R, Vaideeswar P, Arava S, Jain A. COVID-19: An up-to-date review - from morphology to pathogenesis. Indian J Pathol Microbiol. 2020; 63(3):358–366.
[3] Samudrala PK, Kumar P, Choudhary K, Thakur N, Wadekar GS, et al. Virology, pathogenesis, diagnosis and in-line treatment of COVID-19. Eur J Pharmacol. 2020; 883:173375.
[4] Fu J, Kong J, Wang W, Wu M, Yao L, et al. The clinical implication of dynamic neutrophil to lymphocyte ratio and D-dimer in COVID-19: A retrospective study in Suzhou China. Thromb Res. 2020; 192:3–8.
[5] Khalid A, Ali Jaffar M, Khan T, Abbas Lail R, Ali S, et al. Hematological and biochemical parameters as diagnostic and prognostic markers in SARS-COV-2 infected patients of Pakistan: a retrospective comparative analysis. Hematology. 2021; 26(1):529–542.
[6] Terra POC, Donadel CD, Oliveira LC, Menegueti MG, Auxiliadora-Martins M, et al. Neutrophil-to-lymphocyte ratio and D-dimer are biomarkers of death risk in severe COVID-19: A retrospective observational study. Health Sci Rep. 2022; 5:e514.
[7] Yang A, Liu J, Tao W, Li H. The diagnostic and predictive role of NLR, d-NLR and PLR in COVID-19 patients. Int Immunopharmacol. 2020; 84:106504.
[8] Liu Y, Du X, Chen J, Jin Y, Peng L, et al. Neutrophil-to-lymphocyte ratio as an independent risk factor for mortality in hospitalized patients with COVID-19. J Infect. 2020; 81(1):e6–e12.
[9] Ciccullo A, Borghetti A, Zileri Dal Verme L, Tosoni A, Lombardi F, et al. Neutrophil-to-lymphocyte ratio and clinical outcome in COVID-19: a report from the Italian front line. Int J Antimicrob Agents. 2020; 56(2):106017.
[10] Li H, Zhao M, Xu Y. Biochemical analysis between common type and critical type of COVID-19 and clinical value of neutrophil/lymphocyte ratio. Nan Fang Yi Ke Da Xue Xue Bao. 2020; 40(7):965–971.
[11] Hashem MK, Khedr EM, Daef E, Mohamed-Hussein A, Mostafa EF, et al. Prognostic biomarkers in COVID-19 infection: value of anemia, neutrophil-to-lymphocyte ratio, platelet-to-lymphocyte ratio, and D-dimer. Egypt J Bronchol. 2021; 15(1):29.
[12] Gul N, Usman U, Ahmed U, Ali M, Shaukat A, et al. Clinical characteristics and outcomes of COVID-19 pneumonia patients from an intensive care unit in Faisalabad, Pakistan. Authorea. 2020. Available from: http://dx.doi.org/10.22541/au.159863239.99285682
[13] Grasselli G, Greco M, Zanella A, Albano G, Antonelli M, et al. Risk factors associated with mortality among patients with COVID-19 in intensive care units in Lombardy, Italy. JAMA Intern Med. 2020; 180(10):1345–1355.
[14] Gupta S, Hayek SS, Wang W, Chan L, Mathews KS, et al. Factors associated with death in critically ill patients with coronavirus disease 2019 in the US. JAMA Intern Med. 2020; 180(11):1436–1446.
[15] Yamada T, Wakabayashi M, Yamaji T, Chopra N, Mikami T, et al. Value of leukocytosis and elevated C-reactive protein in predicting severe coronavirus 2019 (COVID-19): A systematic review and meta-analysis. Clin Chim Acta. 2020; 509:235–243.
[16] Huang G, Kovalic AJ, Graber CJ. Prognostic Value of Leukocytosis and Lymphopenia for Coronavirus Disease Severity. Emerg Infect Dis. 2020; 26(8):1839–1841.
[17] Tan L, Wang Q, Zhang D, Ding J, Huang Q, et al. Lymphopenia predicts disease severity of COVID-19: a descriptive and predictive study. Signal Transduct Target Ther. 2020; 5(1):33.
[18] Wang S, Fu L, Huang K, Han J, Zhang R, et al. Neutrophil-tolymphocyte ratio on admission is an independent risk factor for the severity and mortality in patients with coronavirus disease 2019. J Infect. 2021; 82(2):e16–e8.
[19] Liu J, Liu Y, Xiang P, Pu L, Xiong H, et al. Neutrophil-to-lymphocyte ratio predicts critical illness patients with 2019 coronavirus disease in the early stage. J Transl Med. 2020; 18(1):206.
[20] Kong M, Zhang H, Cao X, Mao X, Lu Z. Higher level of neutrophil-to lymphocyte is associated with severe COVID-19. Epidemiol Infect. 2020; 148:e139.
[21] Zahorec R, Hulin I, Zahorec P. Rationale use of neutrophil-to lymphocyte ratio for early diagnosis and stratification of COVID-19. Bratisl Lek Listy. 2020; 121(7):466–470.
[22] Soylu K, Gedikli Ö, Ekşi A, Avcıoğlu Y, Soylu AI, et al. Neutrophil-to-lymphocyte ratio for the assessment of hospital mortality in patients with acute pulmonary embolism. Arch Med Sci. 2016; 12(1):95–100.