Full Text
Introduction
Urinalysis is an essential screening and diagnostic tool for evaluating renal and metabolic diseases. Traditionally, it involves chemical strip testing and manual microscopic examination of urinary sediment. However, manual methods are labour-intensive, subjective, and time-consuming [1]. With increasing sample volumes and the need for standardization, automation in urinalysis has gained significant momentum [2, 3].
The Erba Mannheim Laura XL is an advanced urine analyzer that integrates urine strip analysis with automated sediment microscopy using digital imaging. It provides rapid and reproducible results with minimal user intervention. This study evaluates the analytical performance and workflow impact of the Laura XL analyzer in comparison with conventional manual microscopy [2].
Recent advances in automated urinalysis—including high-resolution digital microscopy, integrated strip chemistry, and AI-assisted particle recognition—have enhanced throughput and reduced inter-observer variability, while also minimizing sample volume requirements and hands-on time in mid- to high-volume laboratories [4–6]. Contemporary evaluations highlight that, despite strong concordance for common parameters such as leukocytes, erythrocytes, and casts, automated systems still require clearly defined reflex criteria for manual review and periodic verification against manual microscopy to ensure accurate detection of atypical or clinically significant elements. These workflow and quality-assurance considerations form the rationale for comparing the performance of the Laura XL with manual sediment microscopy [4, 5].
The objective of this study was to comprehensively evaluate the analytical performance of the Erba Mannheim Laura XL automated urine analyzer in comparison with conventional manual urine sediment microscopy. By assessing key sediment parameters—including leukocytes, erythrocytes, epithelial cells, casts, crystals, and microorganisms—the study aimed to determine the degree of concordance between automated and manual method. Additionally, the study sought to analyze whether minor discrepancies between the two approaches could influence clinical interpretation, especially in borderline, infection-prone, or diagnostically challenging cases. This evaluation provides insight into the suitability of the Laura XL for routine use in clinical laboratories.
Materials and methods
This prospective comparative study was conducted in the Department of Pathology at Sri Siddhartha Medical College Hospital over a three-month period from March 2024 to May 2024. Institutional Ethics Committee approval was obtained prior to the commencement of the study. Midstream clean-catch urine samples submitted to the Central Laboratory for routine urinalysis were included. Each sample was divided into three aliquots: two were used for analysis on the automated urine analyzer, and one was reserved for manual microscopic examination. All samples were processed within one hour of collection to minimize cellular degradation and morphological changes.
For manual microscopy, 10 mL of urine was centrifuged at 2000 rpm for 10 minutes. The supernatant (approximately 9.5 mL) was discarded, and the remaining 0.5 mL of sediment was used for slide preparation. A single drop (50 µL) of sediment was placed on a clean glass slide, mixed with one drop of New Methylene Blue stain, and covered with a coverslip. The slides were examined under light microscopy for cellular and non-cellular elements.
Automated urine sediment analysis was performed using the Erba Mannheim Laura XL analyzer, which operates on high-resolution digital imaging and provides automated particle classification with integrated LIS connectivity for seamless result transfer. For each sample, 5 mL of urine was loaded into the analyzer rack and scanned. Digital images of the urine sediment were captured, processed, and categorized by the system’s software before being displayed for interpretation.
The parameters evaluated in both methods included red blood cells (RBCs), white blood cells (WBCs), epithelial cells, organisms, crystals, and casts.
Statistical analysis
Concordance between automated and manual method was assessed using the concordance rate and Cohen’s kappa coefficient. Sensitivity and specificity were calculated for key sediment findings to determine the diagnostic performance of the automated analyzer in comparison with manual microscopy as well as p value for statistical significance.
Results
A total of 120 random midstream urine samples were included in the study, with patient ages ranging from 5 to 80 years (mean age 42.5 years). Of the total samples, 69 (57.5%) were from females and 51 (42.5%) from males, yielding a male-to-female ratio of 1:1.35 (Figure 1).
In all cases, both automated and manual methods successfully generated reportable results, and no sample required repeat analysis due to inadequate volume or technical failure. The Erba Mannheim Laura XL demonstrated stable analytical performance throughout the study period, with no instrument downtime or processing errors recorded. Preliminary comparison showed that the analyzer produced rapid sediment characterization, enabling efficient workflow with a processing time significantly shorter than manual microscopy.

Figure 1: Gender distribution in urine analysis.
Out of 120 samples, manual microscopy identified calcium oxalate crystals in 25 cases (20.8%) and detected one case each of cystine crystals and amorphous crystals. However, the automated analyzer failed to detect the cystine and amorphous crystals (Table 1).
Table 1: Distribution of various types of crystals.
|
Crystal
|
No of cases in manual (n)
|
Percentage (%)
|
No of cases in automated (n)
|
Percentage (%)
|
|
Calcium Oxalate
|
25
|
20.8
|
25
|
20.8
|
|
Calcium phosphate
|
5
|
4.16
|
5
|
4.16
|
|
Triple phosphate
|
6
|
5
|
6
|
5
|
|
Uric acid
|
4
|
3.3
|
4
|
3.3
|
|
Cysteine
|
1
|
0.8
|
0
|
0
|
|
Amorphous
|
1
|
0.8
|
0
|
0
|
Out of 120 samples, bacteria were detected in 18 cases (15%) by both manual microscopy and the automated analyzer. One case (0.8%) of Trichomonas vaginalis was identified on manual microscopy but was not detected by the automated analyzer (Table 2).
Table 2: Distribution of various types of organism.
|
Organism
|
No. of cases in manual (n)
|
Percentage (%)
|
No of cases in automated (n)
|
Percentage (%)
|
|
Bacteria
|
18
|
15
|
18
|
15
|
|
Yeast and hyphae
|
5
|
4.16
|
5
|
4.16
|
|
Trichomonas vaginalis
|
1
|
0.8
|
0
|
0
|
Manual microscopic and automated features of Candida in urinalysis showed numerous yeast forms and pseudo-hyphae (Figure 2).
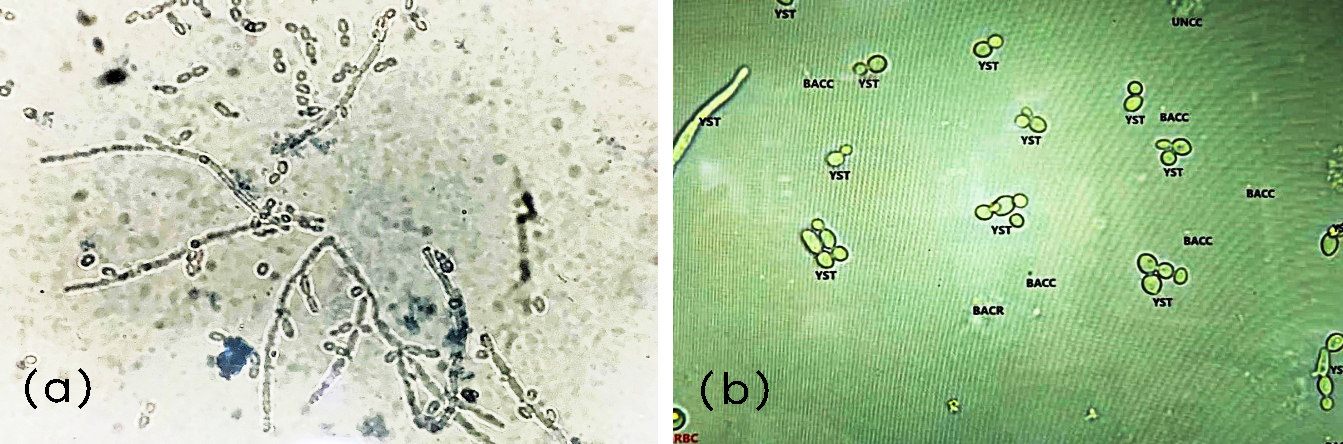
Figure 2: (a) Manual microscopy showing Candida at 400× magnification; (b) Erba Mannheim Laura XL image demonstrating Candida.
Comparative analysis Erba Mannheim Laura XL v/s manual microscopy
When compared the frequency of WBC in automated analyser with manual microscopy, it showed statistical significance with a p value of <0.05 (Table 3).
Table 3: Comparing frequency of white blood cells per high power field (HPF) in automated analyser vs manual microscopy.
|
WBC
|
Manual
|
Automated
|
|
Patient (n)
|
Percentage (%)
|
Patient (n)
|
Percentage (%)
|
|
2-5/hpf
|
52
|
43.3
|
38
|
31.7
|
|
6-10/hpf
|
6
|
5
|
5
|
4.2
|
|
11-20/hpf
|
10
|
8.3
|
7
|
5.8
|
|
>20/hpf
|
8
|
6.7
|
6
|
5
|
|
Absent
|
44
|
36.7
|
64
|
53.3
|
|
p value
|
<0.05
|
Manual microscopy and automated urinalysis showed numerous pus cells (Figure 3).
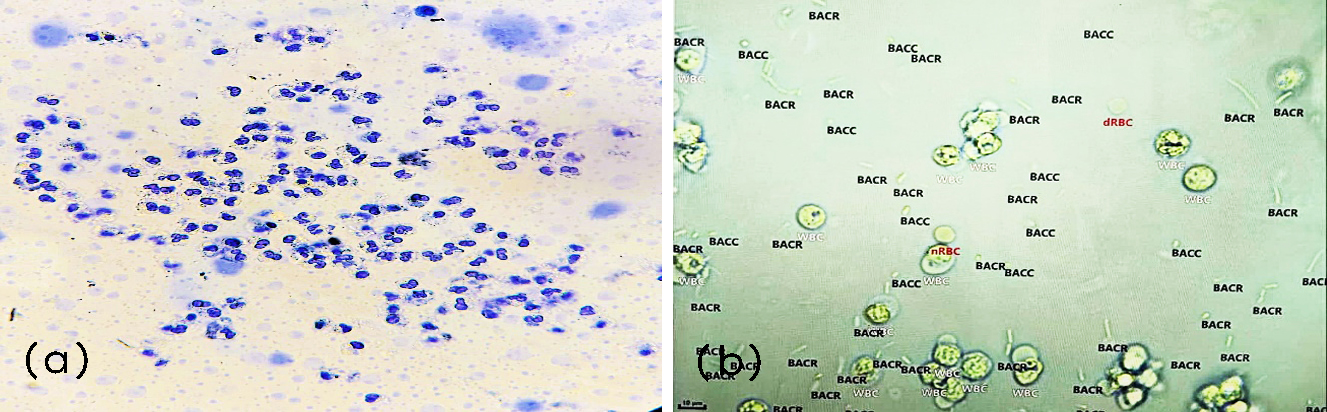
Figure 3: (a) Manual microscopy of Pus cells, under 400X, (b) Erba Mannheim Laura XL - pus cells.
When compared the frequency of RBC in Automated analyser with Manual microscopy, it showed statistical significance with a p value of <0.05 (Table 4).
Table 4: Comparing frequency of red blood cells per high power field (HPF) in automated analyser vs manual microscopy.
|
RBC
|
Manual
|
Automated
|
|
Patient (n)
|
Percentage (%)
|
Patient (n)
|
Percentage (%)
|
|
<2/hpf
|
41
|
34.2
|
38
|
31.7
|
|
2-5/hpf
|
8
|
6.7
|
7
|
5.8
|
|
6-10/hpf
|
4
|
3.3
|
4
|
3.3
|
|
>10/hpf
|
2
|
1.7
|
2
|
1.7
|
|
Absent
|
65
|
54.1
|
69
|
57.5
|
|
p value
|
<0.05
|
When compared the frequency of Epithelial cells in Automated analyser with Manual microscopy, it showed statistical significance with a p value of <0.01 (Table 5).
Table 5: Comparing frequency of Epithelial cells per high power field (HPF) in Automated analyser vs Manual microscopy.
|
Epithelial cells
|
Manual
|
Automated
|
|
Patient (n)
|
Percentage (%)
|
Patient (n)
|
Percentage (%)
|
|
0-5/hpf
|
66
|
55
|
66
|
55
|
|
6-10/hpf
|
31
|
25.8
|
31
|
25.8
|
|
11-20/hpf
|
8
|
6.7
|
8
|
6.7
|
|
>20/hpf
|
2
|
1.7
|
2
|
1.7
|
|
Absent
|
13
|
10.8
|
13
|
10.8
|
|
p value
|
<0.01
|
When compared the frequency of crystals in automated analyser with manual microscopy, it showed statistical significance with a p value of <0.05 (Table 6).
Table 6: Comparing frequency of crystals per high power field (HPF) in automated analyser vs manual microscopy.
|
Crystals
|
Manual
|
Automated
|
|
Patient (n)
|
Percentage (%)
|
Patient (n)
|
Percentage (%)
|
|
0-10/hpf
|
29
|
24.2
|
29
|
24.2
|
|
>10/hpf
|
13
|
10.8
|
11
|
9.2
|
|
Absent
|
78
|
65
|
80
|
66.6
|
|
p value
|
<0.05
|
When compared the frequency of casts in automated analyser with manual microscopy, it showed statistical significance with a p value of <0.01 (Table 7).
Table 7: Comparing frequency of casts per high power field (HPF) in automated analyser vs manual microscopy.
|
Casts
|
Manual
|
Automated
|
|
Patient (n)
|
Percentage (%)
|
Patient (n)
|
Percentage (%)
|
|
0-5/hpf
|
33
|
27.5
|
33
|
27.5
|
|
6-10/hpf
|
13
|
10.8
|
13
|
10.8
|
|
>10/hpf
|
9
|
7.5
|
9
|
7.5
|
|
Absent
|
65
|
54.2
|
65
|
54.2
|
|
p value
|
<0.01
|
When compared the frequency of Organisms in Automated analyser with Manual microscopy, it showed statistical significance with a p value of <0.05 (Table 8).
Table 8: Comparing frequency of organisms in automated analyser vs manual microscopy.
|
Organisms
|
Manual
|
Automated
|
|
Patient (n)
|
Percentage (%)
|
Patient (n)
|
Percentage (%)
|
|
Present
|
24
|
20
|
23
|
19.2
|
|
Absent
|
96
|
80
|
97
|
80.8
|
|
p value
|
<0.05
|
In comparison between the automated analyzer and manual microscopic examination, the concordance analysis demonstrated 100% specificity and negative predictive value. The automated system also showed high specificity, positive predictive value, and overall accuracy (Table 9).
Table 9: Estimating different concordances on automated analyser compared to manual microscopy.
|
Variables
|
Automated Vs Manual
|
|
Specificity
|
Sensitivity
|
PPV
|
NPV
|
Accuracy
|
|
WBC
|
100
|
97.5
|
98.2
|
98.4
|
98.6
|
|
RBC
|
100
|
99.1
|
98.8
|
99.7
|
99.8
|
|
Epithelial cells
|
100
|
100
|
100
|
100
|
100
|
|
Crystals
|
100
|
98.8
|
99.1
|
99.7
|
99.7
|
|
Casts
|
100
|
100
|
100
|
100
|
100
|
|
Organisms
|
100
|
98.7
|
99.1
|
99.7
|
99.8
|
Discussion
In this study, microscopic urinalysis was performed using both manual microscopy and the Erba Mannheim Laura XL automated analyzer, and the findings from the two methods were compared to assess statistical significance and diagnostic accuracy. Manual microscopy, performed at 400× magnification, served as the reference method for identifying leukocytes, erythrocytes, epithelial cells, crystals, casts and microorganisms. The automated analyzer demonstrated statistically significant agreement with manual microscopy across most parameters (p < 0.05), indicating strong comparative performance.
When compared with the study conducted by Ratnakar et al. [2] in 2025, the present analysis demonstrated 100% specificity and negative predictive value (NPV) for WBCs, RBCs, epithelial cells, crystals, casts and organisms. In contrast, Ratnakar et al. [2] reported specificity values lower than 100% across all measured parameters and noted discordance in specificity, sensitivity, positive predictive value (PPV), and NPV for WBCs, RBCs, crystals, casts and organisms, except that the concordance between the two studies was observed in Epithelial cell detection, where both reported 100% sensitivity and NPV (Table 10).
Table 10: Comparison of various cell counts by the Laura XL in our study with the study by Ratnakar et al. [2].
|
Laura XL
|
Sensitivity (%)
|
Specificity (%)
|
PPV (%)
|
NPV (%)
|
|
Ratnakar PJ et al
|
Present study
|
Ratnakar PJ et al
|
Present study
|
Ratnakar PJ et al
|
Present study
|
Ratnakar PJ et al
|
Present study
|
|
WBC
|
94.6
|
98
|
41.1
|
100
|
71.7
|
98
|
85.7
|
100
|
|
RBC
|
95.7
|
99
|
74.1
|
100
|
86.5
|
99
|
90.9
|
100
|
|
Epithelial cell
|
100
|
100
|
77
|
100
|
88.7
|
100
|
100
|
100
|
|
Crystal
|
81
|
99
|
90
|
100
|
27
|
99
|
73
|
100
|
|
Cast
|
95
|
100
|
40
|
100
|
61
|
100
|
67
|
100
|
|
Organism
|
98
|
99
|
59
|
100
|
93
|
199
|
83
|
100
|
Several previous studies have also highlighted the growing reliability and clinical value of automated urinalysis systems, supporting the findings of the present study. Dhand et al. [3] reported strong agreement between automated analyzers and manual microscopy, emphasizing their utility in routine diagnostic workflows and their ability to significantly reduce technician workload. Studies from South Asia have similarly demonstrated high concordance for common sediment parameters, with Sultana et al. [4] noting particularly strong correlation for leukocytes, erythrocytes, and bacteria, reinforcing the diagnostic potential of automated systems in diverse laboratory settings. Broader reviews by Oyaert and Delanghe [5] have further documented substantial progress in automated urinalysis, including advanced digital imaging, improved particle classification, and enhanced reproducibility compared with manual methods. Comparative analyses involving multiple analyzers also show that automated platforms consistently perform on par with manual microscopy for most routine elements, as demonstrated by Yoon et al. [6] in their evaluation of five automated systems. Jung et al. [7] similarly observed high accuracy for detecting WBCs, RBCs, and bacteria, underscoring the clinical applicability of these technologies in modern laboratories.
The implementation of the Erba Mannheim Laura XL also demonstrated substantial improvements in workflow efficiency. The analyzer processed an average of 70–80 samples per hour, with strip reading completed in approximately one minute and sediment processing with digital imaging requiring only 2–3 minutes per sample. This rapid turnaround time significantly reduced overall staff workload, cutting manual labour requirements by nearly 40–50%, particularly during high-volume batches. Furthermore, full integration with the laboratory information system (LIS) streamlined data transfer, minimized transcription errors, and enhanced the reliability of result reporting. These operational advantages highlight the practical utility of automated urinalysis systems in modern diagnostic laboratories.
Conclusion
The Erba Mannheim Laura XL proves to be a reliable, time-efficient, and analytically robust automated urinalysis system, demonstrating excellent concordance with manual urine sediment microscopy for key parameters such as leukocytes, erythrocytes, epithelial cells, crystals, and organisms. Its rapid processing capability and high-throughput performance significantly enhance laboratory productivity while reducing operator workload and minimizing subjective variability. Seamless integration with Laboratory Information Systems (LIS) further reduces transcription errors and supports a streamlined workflow, underscoring its value in medium- to high-volume clinical laboratories. Although the analyzer performs exceptionally well for routine parameters, selective manual review remains essential for atypical, borderline, or diagnostically critical findings such as rare crystals, unusual casts, or protozoal elements. Overall, the Laura XL represents an effective adjunct to conventional microscopy and aligns with the evolving shift toward digital and automated diagnostics in modern pathology laboratories.
Conflicts of interest
Authors declare no conflict of interest.
References
[1] Agarwal R, Acharya V, Mahapatra M, Yadav A, Pant L. Automated urine analysis: Comparison of cobas u701 microscopy analyzer and manual microscopy. J Lab Physicians. 2021; 13 :30–35.
[2] Ratnakar PJ, Sharma N, Gupta R, Patel S, Kumar A, et al. Performance evaluation of automated urine analyzers. SEEJPH. 2025; 26:5730–5738.
[3] Dhand D, Sharma N, Gupta R, Patel S, Kumar A. Automated urine analyser vs manual microscope examination for urinalysis comparison. Int J Life Sci Biotechnol Pharm Res. 2024; 13:61–69.
[4] Gyamfi NKA, Osei GN, Brenyah RC, Agyemang LD, Ampomah P, Darkwah KO, et al. Assessing concordance of results: A comparative study of the manual and automated urinalysis methods. Biomed Res Int. 2024;2024:6963423.
[5] Liu Y, Wang H, Zhang J, Zhao X, Li P, et al. Performance evaluation and clinical application of the UA-5600 automated urine analyzer. Transl Androl Urol. 2024; 13:1024–1036.
[6] Larkey NE. Advances and progress in automated urine analyzers. Clin Lab Med. 2024; 44:409–421.
[7] Dhand D, Sharma N, Gupta R, Patel S, Kumar A. Automated urine analyser vs manual microscope examination for urinalysis comparison. Int J Life Sci Biotechnol Pharm Res. 2024; 13:61–69.
[8] Sultana R, Rahman MA, Jahan I, Khatun F, Sultana N, Rahman MM. Automated urine analyser vs manual microscope examination for urinalysis: Comparison and correlation. Mymensingh Med J. 2019; 28:82–87.
[9] Oyaert M, Delanghe J. Progress in automated urinalysis. Ann Lab Med. 2019; 39:1–9.
[10] Yoon J, Shim YJ, Kim Y, Kim JW. Comparison of five automated urine sediment analyzers with manual microscopy. Clin Chem Lab Med. 2019; 57:452–461.
[11] Jung BK, Lee A, Jung HI, Park YH. Comparison of automated and manual urine sediment analysis for detection of white blood cells, red blood cells and bacteria. Ann Lab Med. 2015; 35:506–512.