Full Text
Introduction
Metabolic syndrome (MS), a cluster of metabolic abnormalities including obesity, hypertension, dyslipidemia, and insulin resistance, is an emerging public health concern in India and South Asia. Recent studies highlight its increasing prevalence and associated risk factors, underscoring the urgency of addressing this condition. A study by Basu provides a comprehensive analysis of the burden and determinants of MS among older adults in India [1]. This nationally representative community-based cross-sectional survey reported a gross prevalence of 4.83% among individuals aged over 45 years, with significant regional variations. Prevalence rates ranged from 28.6% in northern India to 45.9% in southern regions, with biomedical and psychosocial factors contributing significantly to these differences.
A systematic review and meta-analysis by Krishnamoorthy et al. estimated an overall MS prevalence of 30.0% in the adult Indian population, with regional variations: Northern, Western, and Southern India showed a prevalence of 30.0%, Eastern India 33.0%, North-Eastern India 35.0%, and Central India 27.0%. The prevalence increased progressively with age, rising from 13.0% in individuals aged 18–29 years to 50.0% among those aged 50–59 years [2]. Urban populations exhibited a higher prevalence (32.0%) compared to tribal (28.0%) and rural populations (22.0%), and women had a greater burden (35.0%) compared to men (26.0%). A 2024 review by Pati and Chandra echoed these findings, estimating an overall prevalence of 31.5% while highlighting gender and regional disparities [3, 4]. However, differences in regional classification methods across studies contributed to variations in prevalence estimates.
Research in South India further underscores the multifactorial nature of MS. A 2019 cross-sectional study among a rural population reported a prevalence of 39.7%, with higher rates observed in individuals aged 45–49 years, those from higher socio-economic groups, and individuals with low fruit intake and physical inactivity [5]. Additional risk factors included the use of refined sunflower oil for cooking and high perceived stress levels, though associations with low vegetable intake, tobacco use, and alcohol consumption were not statistically significant.
Urbanization and lifestyle changes are pivotal in the rising prevalence of MS. The study by Shankar (2023) emphasized the role of urbanization, dietary shifts, and sedentary lifestyles in increasing MS prevalence [6]. Similarly, research by Banerjee (2023) among corporate IT employees in South India revealed that sedentary work environments and poor dietary habits significantly elevate MS risk, illustrating the health impact of modern urban employment [7]. Personal habits such as diet, physical activity, and sleep patterns play a crucial role in MS development. Faster eating speeds were significantly associated with increased MS risk and its components (Yuan et al., 2021) [8]. A randomized clinical trial by Ismael (2021) demonstrated that low-carbohydrate diets reduced MS prevalence compared to low-fat diets [9]. Regular aerobic and strength-training exercises have also been linked to lower MS risk (Lee, 2022) [10]. Recent studies have also highlighted the relationship between sleep habits and metabolic syndrome in adults, emphasizing the significance of sleep duration and quality [11, 12].
The study aimed to assess the impact of metabolic syndrome (MS) as a complex condition and analyse the challenges MS poses to clinicians and public health specialists and also study the multifaceted nature of MS, highlighting age, BMI, dietary habits, and physical activity levels as key risk factors.
Methods
Study design and sampling technique
A cross-sectional analytical study was conducted in the catchment area of a Family Health Centre, Pangappara, Thiruvananthapuram district of Kerala. The sample size was calculated based on a prevalence rate of 30% (Krishnamoorthy Y et al., 2020), with a 95% confidence interval a 5% margin of error, resulting in a total sample size of 323. A total of 342 eligible participants were randomly selected from the list of the adults in the health center during the period from January 2021 to December 2022. Pregnant and severely ill and bedridden individuals were excluded from the study. The study received institutional human ethics committee clearance, and written informed consent was obtained from all participants prior to data collection.
Data collection tools and measurements
Data collection was conducted using a structured questionnaire and the Global Physical Activity Questionnaire (GPAQ), developed by the World Health Organization for the assessment of physical activity. Following variables were collected: age, gender, religion, education status, occupation, income, family history of non-communicable diseases, use of oral contraceptives pills, smoking, alcoholism, Regular Physical activity: Those who involved in 30 minutes brisk walking/cycling/swimming or games at least 5 days in a week defined as having regular physical activity). WHO recommendation on physical activity for health is defined as throughout a week including activity for work, during transport and leisure time, adults should do at least, 150 minutes of moderate-intensity physical activity or 75 minutes of vigorous intensity physical activity or an equivalent combination of moderate and vigorous intensity physical activity at least 600 (Metabolic Equivalent) MET-minutes.
Diet habits
One week’s diet consumed was collected to assess the average servings of cereals, pulses, vegetables, fruits, meat, and poultry consumed. Nil or < 5 days in a week of fruits and vegetable intake, no green leafy vegetable intake in a week, less than 3 days of fruits intake in a week, less than 3 days of vegetable intake in a week, more than 11 servings of cereals & pulses in a day and more than 3 serving of meat and poultry in a day were considered as risk factors. One serving is one cup which is equal to 100g. Anthropometric measurements included, weight, height, waist circumference, and hip circumference. Blood pressure recorded using mercury Sphygmomanometer and average of two measurements within five minutes was recorded.
Laboratory measurements were done at Central lab, Department of Biochemistry, Medical College, Thiruvananthapuram. 7 ml of fasting venous blood was collected in polypropylene tubes and specimens are centrifuged at 3000 rpm for 10 minutes to obtain serum. All the chemicals and reagents used in the study are of analytical grade. Serum lipoproteins (serum triglycerides, high-density lipoprotein (HDL), and cholesterol were determined by use of autoanalyzer (Olympus) and FBS by glucose oxidase kit. All biophysical measurements adhered to standard procedures.
Definition of metabolic syndrome (ATPIII) [13]
Participants were classified as having metabolic syndrome (MS) if they met at least three of the following five criteria:
1. Central Obesity: Waist circumference ≥90 cm for men and ≥80 cm for women.
2. Elevated Triglyceride Levels: ≥150 mg/dL (1.7 mmol/L) or currently receiving treatment for this condition.
3. Reduced HDL Cholesterol: <40 mg/dL (1.03 mmol/L) for males and <50 mg/dL (1.29 mmol/L) for females, or currently receiving treatment for this condition.
4. Elevated Blood Pressure: Systolic blood pressure ≥130 mmHg or diastolic blood pressure ≥85 mmHg, or currently receiving treatment for hypertension.
5. Elevated Fasting Plasma Glucose (FPG): ≥100 mg/dL (5.6 mmol/L) or previously diagnosed with type 2 diabetes.
Data analysis
Quantitative variables were presented as mean ± standard deviation (SD), while categorical variables were summarized as frequencies and percentages. The prevalence of metabolic syndrome was reported with a 95% confidence interval. Differences in quantitative variables were assessed using the t-test, and categorical variables were compared using the chi-square test. Odds ratios (ORs) with 95% confidence intervals were calculated to assess the strength of associations. Logistic regression analysis was conducted to identify the impact of socio-clinical and personal variables on the development of metabolic syndrome. SPSS version 27 and Jamovi version2.3.28 were used for data analysis.
Results
The prevalence of metabolic syndrome was 41.8% and the 95% confidence interval was 35.2% to 49.3% (Figure 1).
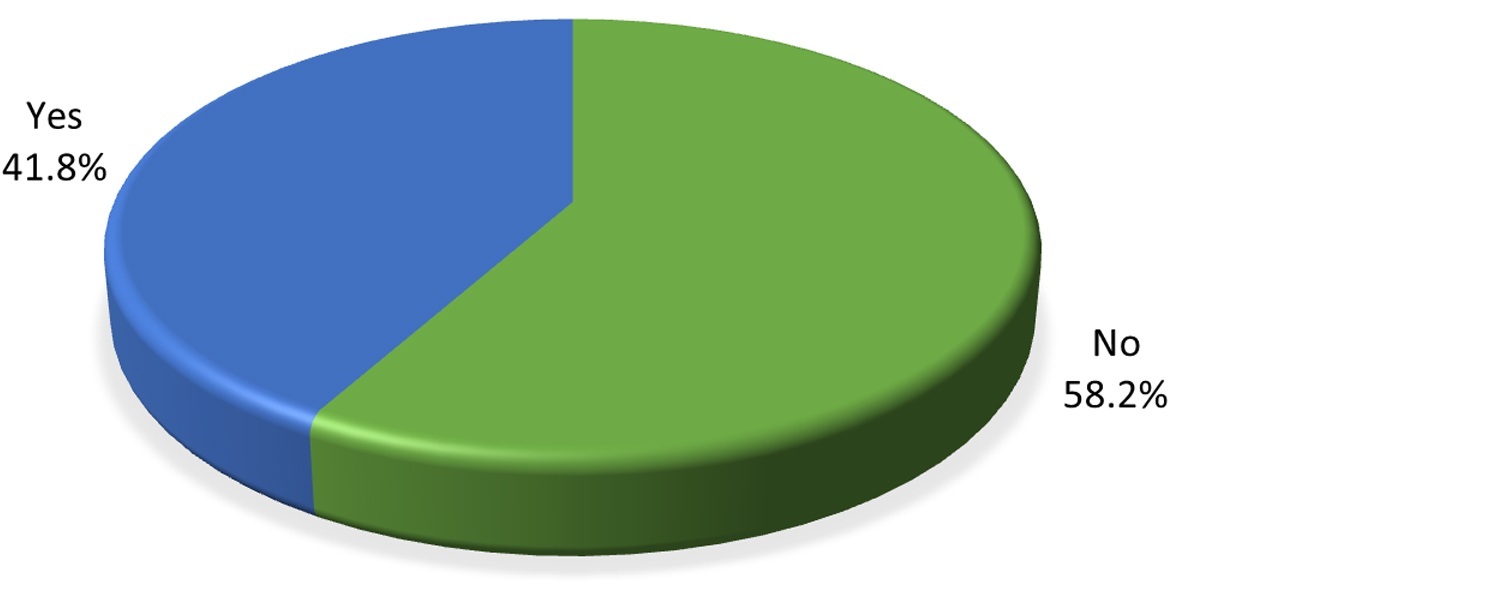
Figure 1: Pie chart showing prevalence of metabolic syndrome.
Table 1: Association of socio demographic and clinical variables on metabolic syndrome.
|
Independent
variable
|
Metabolic syndrome
|
Total
|
χ2 d
|
p value
|
ORe
|
95% CIf
|
|
No(%)
|
Yes(%)
|
|
|
|
|
|
|
Age(years)
|
|
|
>40
≤40
|
73(46.8)
126(67.7)
|
83(53.2)
60(32.3)
|
156
186
|
15.3
|
0.001
|
2.39
|
1.54 - 3.71
|
|
Gender
|
|
|
Female
Male
|
106(53.5)
93(64.6)
|
92 (46.5)
51 (35.4)
|
198
144
|
4.2
|
0.041
|
1.58
|
1.01 – 2.46
|
|
Education
|
|
|
Above high school
High school or below
|
120(55.3)
79(63.2)
|
97(44.7)
46(36.8)
|
217
125
|
2
|
0.154
|
0.72
|
0.46 - 1.13
|
|
|
Occupation
|
|
|
|
|
|
|
|
|
|
Low
High
|
158(55.6)
41(70.7)
|
126(44.4)
17(29.3)
|
284
58
|
4.5
|
0.034
|
1.9
|
1.0-3.5
|
|
Income
|
|
|
≤5000
>5000
|
131(55.5)
68(64.2)
|
105(44.5)
38(35.8)
|
236
106
|
2.24
|
0.134
|
1.4
|
0.89-2.29
|
|
Marital status
|
|
|
Ever married
Unmarried
|
180 (57.1)
19 (70.4)
|
135(42.9)
8(29.6)
|
315
27
|
1.8
|
0.181
|
1.8
|
0.75-4.19
|
|
Family history
|
|
|
Yes
No
|
111(51.9)
88(68.8)
|
103(48.1)
40(31)
|
128
214
|
9.4
|
0.002
|
2
|
1.3-3.2
|
|
Smoking status
|
|
|
No
Yes
|
182 (57.4)
17(68)
|
135(42.6)
8(32)
|
317
25
|
1.1
|
0.302
|
0.63
|
0.27 - 1.51
|
|
Alcoholic status
|
|
|
No
Yes
|
185(57.3)
14(73.7)
|
138(42.7)
5(26.3)
|
323
19
|
2
|
0.159
|
0.48
|
0.17 - 1.36
|
|
BMIa
|
|
|
≥25
<25
|
98(43.8)
101(85.6)
|
126(56.3)
17(14.4)
|
224
118
|
55.6
|
0.001
|
7.64
|
4.29-13.61
|
|
WHRb
|
|
|
Abnormal
Normal
|
144(52.2)
55(83.3)
|
132(47.8)
11(16.7)
|
276
66
|
21.3
|
0.001
|
4.58
|
2.3 - 9.13
|
|
Total cholesterol
|
|
|
Abnormal(≥200mg/dl)
Normal(<200mg/dl)
|
75(44.6)
124(71.3)
|
93(55.4)
50(28.7)
|
168
174
|
24.9
|
0.001
|
3.08
|
1.97 - 4.81
|
|
Regular physical activity
|
|
|
No
Yes
|
109(50.7)
90(70.9)
|
106(49.3)
37(29.1)
|
215
127
|
13.3
|
0.001
|
2.37
|
1.48 - 3.77
|
|
GPAQc Recommendation
|
|
|
Not satisfied
Satisfied
|
74(42.8)
125(74)
|
99(57.2)
44(26)
|
173
169
|
34.2
|
0.001
|
3.8
|
2.41 - 6
|
Abbreviations: BMIa -Body Mass Index, WHRb-Waist hip ratio, GPAQc- Global Physical Activity Questionnaire, χ2 d – ch-square test ORe -Odds ratio, 95% CIf– 95% confidence Interval.
Age was a significant determinant, with individuals over 40 years old showing an odds ratio (OR) of 2.39. Gender also played a role, an OR of 1.58 indicating a higher risk for women. Additionally, individuals with a family history of non-communicable disease exhibited an OR of 2.00. BMI was another critical factor, with 56.3% of individuals with a BMI of 25 or higher affected by MS, compared to only 14.4% in those with a BMI below 25, resulting a OR of 7.64. Furthermore, those with abnormal waist-hip ratios (WHR) had a prevalence of 47.8%, while only 16.7% of individuals with normal WHR were affected, leading to an OR of 4.58. Total cholesterol levels significantly impacted MS prevalence, resulting in an OR of 3.08.
Regular physical activity was associated with a notable difference in prevalence, as 49.3% of individuals who did not engage in regular physical activity had MS, compared to only 29.1% of those who did, resulting in an odds ratio (OR) of 2.37. Lastly, adherence to the Physical Activity Questionnaire (GPAQ) recommendations was significant, with 57.2% of individuals who were not satisfied with their physical activity levels affected by MS, compared to only 26% of those who were satisfied, resulting in an OR of 3.80. These finding suggested that individuals who did not meet the recommended physical activity levels were at a significantly higher risk for metabolic syndrome.
Table 2: Association of dietary habits on metabolic syndrome.
|
|
Metabolic syndrome
|
Total
|
χ2 b
|
p
|
OR c
|
95%CI d
|
|
No(%)
|
Yes(%)
|
|
Diet
|
|
|
Non vegetarian
Vegetarian
|
196(58)
3(75)
|
142(42)
1(25)
|
338
4
|
0.5
|
0.493
|
0.46
|
0.05-4.47
|
|
Fruit and vegetable intake
|
|
|
Fruit inadequate
Adequate
|
91(65)
108(53.5)
|
49(35)
94(46.5)
|
140
202
|
4.5
|
0.033
|
1.62
|
1.04-2.52
|
|
|
Vegetable intake
Inadequate
Adequate
|
6(75)
193(57.8)
|
2(25)
141(42.2)
|
8
334
|
1
|
0.329
|
2.19
|
0.44-11.02
|
|
GLV Intakea
|
|
|
No
Yes
|
145(62.5)
54(49.1)
|
87(37.5)
56(50.9)
|
232
110
|
5.5
|
0.019
|
1.73
|
1.09 - 2.73
|
|
Meat and poultry
|
|
|
>3 serving/day
≤3 serving/day
|
153(53.7)
46(80.7)
|
132(46.3)
11(19.3)
|
285
57
|
14.3
|
0.001
|
3.61
|
1.8 - 7.25
|
Abbreviations: GLV Intakea – Green leafy vegetable Intake, χ2 b - chi-square test ORc – Odds ratio, 95%CId – 95% confidence Interval.
Intake of green leafy vegetables (GLV) showed significance, with 50.9% of individuals hadn’t consumed GLV in a week, while only 37.5% consumed GLV resulting in an OR of 1.73. This indicated that individuals not consuming GLV had a higher likelihood of developing MS. The risky intake of meat and poultry was another significant factor, as 46.3% of individuals with such dietary habits had MS, compared to 19.3% of those without risky meat intake, leading to an OR of 3.61.
Table 3: Results of univariate and multi variable analysis on factors affecting metabolic syndrome.
|
Independent variables
|
Metabolic syndrome
|
ORc (univariable)
|
ORd (multivariable)
|
|
No
|
Yes
|
|
Age
|
|
|
≤40
>40
|
126(67.7)
73(46.8)
|
60(32.3)
83(53.2)
|
2.39 (1.54-3.7)
p<0.001
|
2.24 (1.31-3.89, p=0.004)
|
|
Gender
|
|
|
Male
Female
|
50 (69.4)
149 (55.2)
|
22 (30.6)
121 (44.8)
|
1.85 (1.07-3.27, p=0.031)
|
0.84 (0.40-1.77, p=0.638)
|
|
BMI
|
|
|
<25
≥25
|
101 (85.6)
98 (43.8)
|
17 (14.4)
126 (56.2)
|
7.64 (4.38-14.00, p<0.001)
|
4.69 (2.49-9.25, p<0.001)
|
|
Total cholesterol
|
|
|
Normal
Abnormal
|
124 (71.3)
75 (44.6)
|
50 (28.7)
93 (55.4)
|
3.08 (1.97-4.84, p<0.001)
|
2.65 (1.52-4.66, p=0.001)
|
|
Fruit & vegetables intake
|
|
|
No
Yes
|
91 (65.0)
108 (53.5)
|
49 (35.0)
94 (46.5)
|
1.62 (1.04-2.53, p=0.034)
|
1.83 (1.06-3.21, p=0.033)
|
|
GLV intakea
|
|
|
No
Yes
|
145 (62.5)
54 (49.1)
|
87 (37.5)
56 (50.9)
|
1.73 (1.09-2.74, p=0.019)
|
2.02 (1.12-3.70, p=0.020)
|
|
Meat & poultry risk intake
|
|
|
No(<3serving)
Yes(≤3 serving)
|
46 (80.7)
153 (53.7)
|
11 (19.3)
132 (46.3)
|
3.61 (1.86-7.59, p<0.001)
|
2.42 (1.10-5.64, p=0.032)
|
|
GPAQb
|
|
|
Meets recommendations
Does not meet recommendations
|
125 (74.0)
74 (42.8)
|
44 (26.0)
99 (57.2)
|
3.80 (2.42-6.04, p<0.001)
|
4.47 (2.45-8.42, p<0.001)
|
|
Occupation
|
|
|
High
Low
|
37 (63.8)
162 (57.0)
|
21 (36.2)
122 (43.0)
|
1.33 (0.75-2.41, p=0.343)
|
1.31 (0.65-2.67, p=0.455)
|
|
Family history
|
|
|
No
Yes
|
81 (63.3)
118 (55.1)
|
47 (36.7)
96 (44.9)
|
1.40 (0.90-2.21, p=0.140)
|
1.49 (0.86-2.61, p=0.154)
|
Abbreviations: GLV intakea – Green leafy vegetable Intake, GPAQb - Global Physical Activity Questionnaire, ORc (univariable) – odds ratio of univariable statistical test, ORd (multivariable – odds ratio of multivariable statistical test.
Age was a notable factor, resulting in an odds ratio (OR) of 2.39 in univariable analysis and 2.24 in multivariable analysis. Gender also played a role, with an univariable OR of 1.85 however, this association was not significant in the multivariable analysis (OR: 0.84). BMI was a strong risk factor, yielding an OR of 7.64 in univariable analysis and 4.69 in multivariable analysis. Total cholesterol levels were similarly significant, with an OR of 3.08 for abnormal levels in univariable analysis and 2.65 in multivariable analysis. Dietary factors also emerged as important, with inadequate fruit and vegetable intake associated with an OR of 1.62 (univariable) and 1.83 (multivariable), while no intake of green leafy vegetables (GLVI) had an OR of 1.73 (univariable) and 2.02 (multivariable). The consumption of meat and poultry was another critical factor with an OR of 3.61 in univariable analysis and 2.42 in multivariable analysis. Physical activity levels were crucial, as individuals not meeting GPAQ recommendations had an OR of 3.80 (univariable) and 4.47 (multivariable). In contrast, occupation and family history did not show significant associations with MS, with ORs of 1.33 and 1.40, respectively, in univariable analysis, and 1.31 and 1.49 in multivariable analysis. Overall, the analysis revealed the significant impact of age, BMI, cholesterol levels, dietary habits, and physical activity on the risk of developing metabolic syndrome.
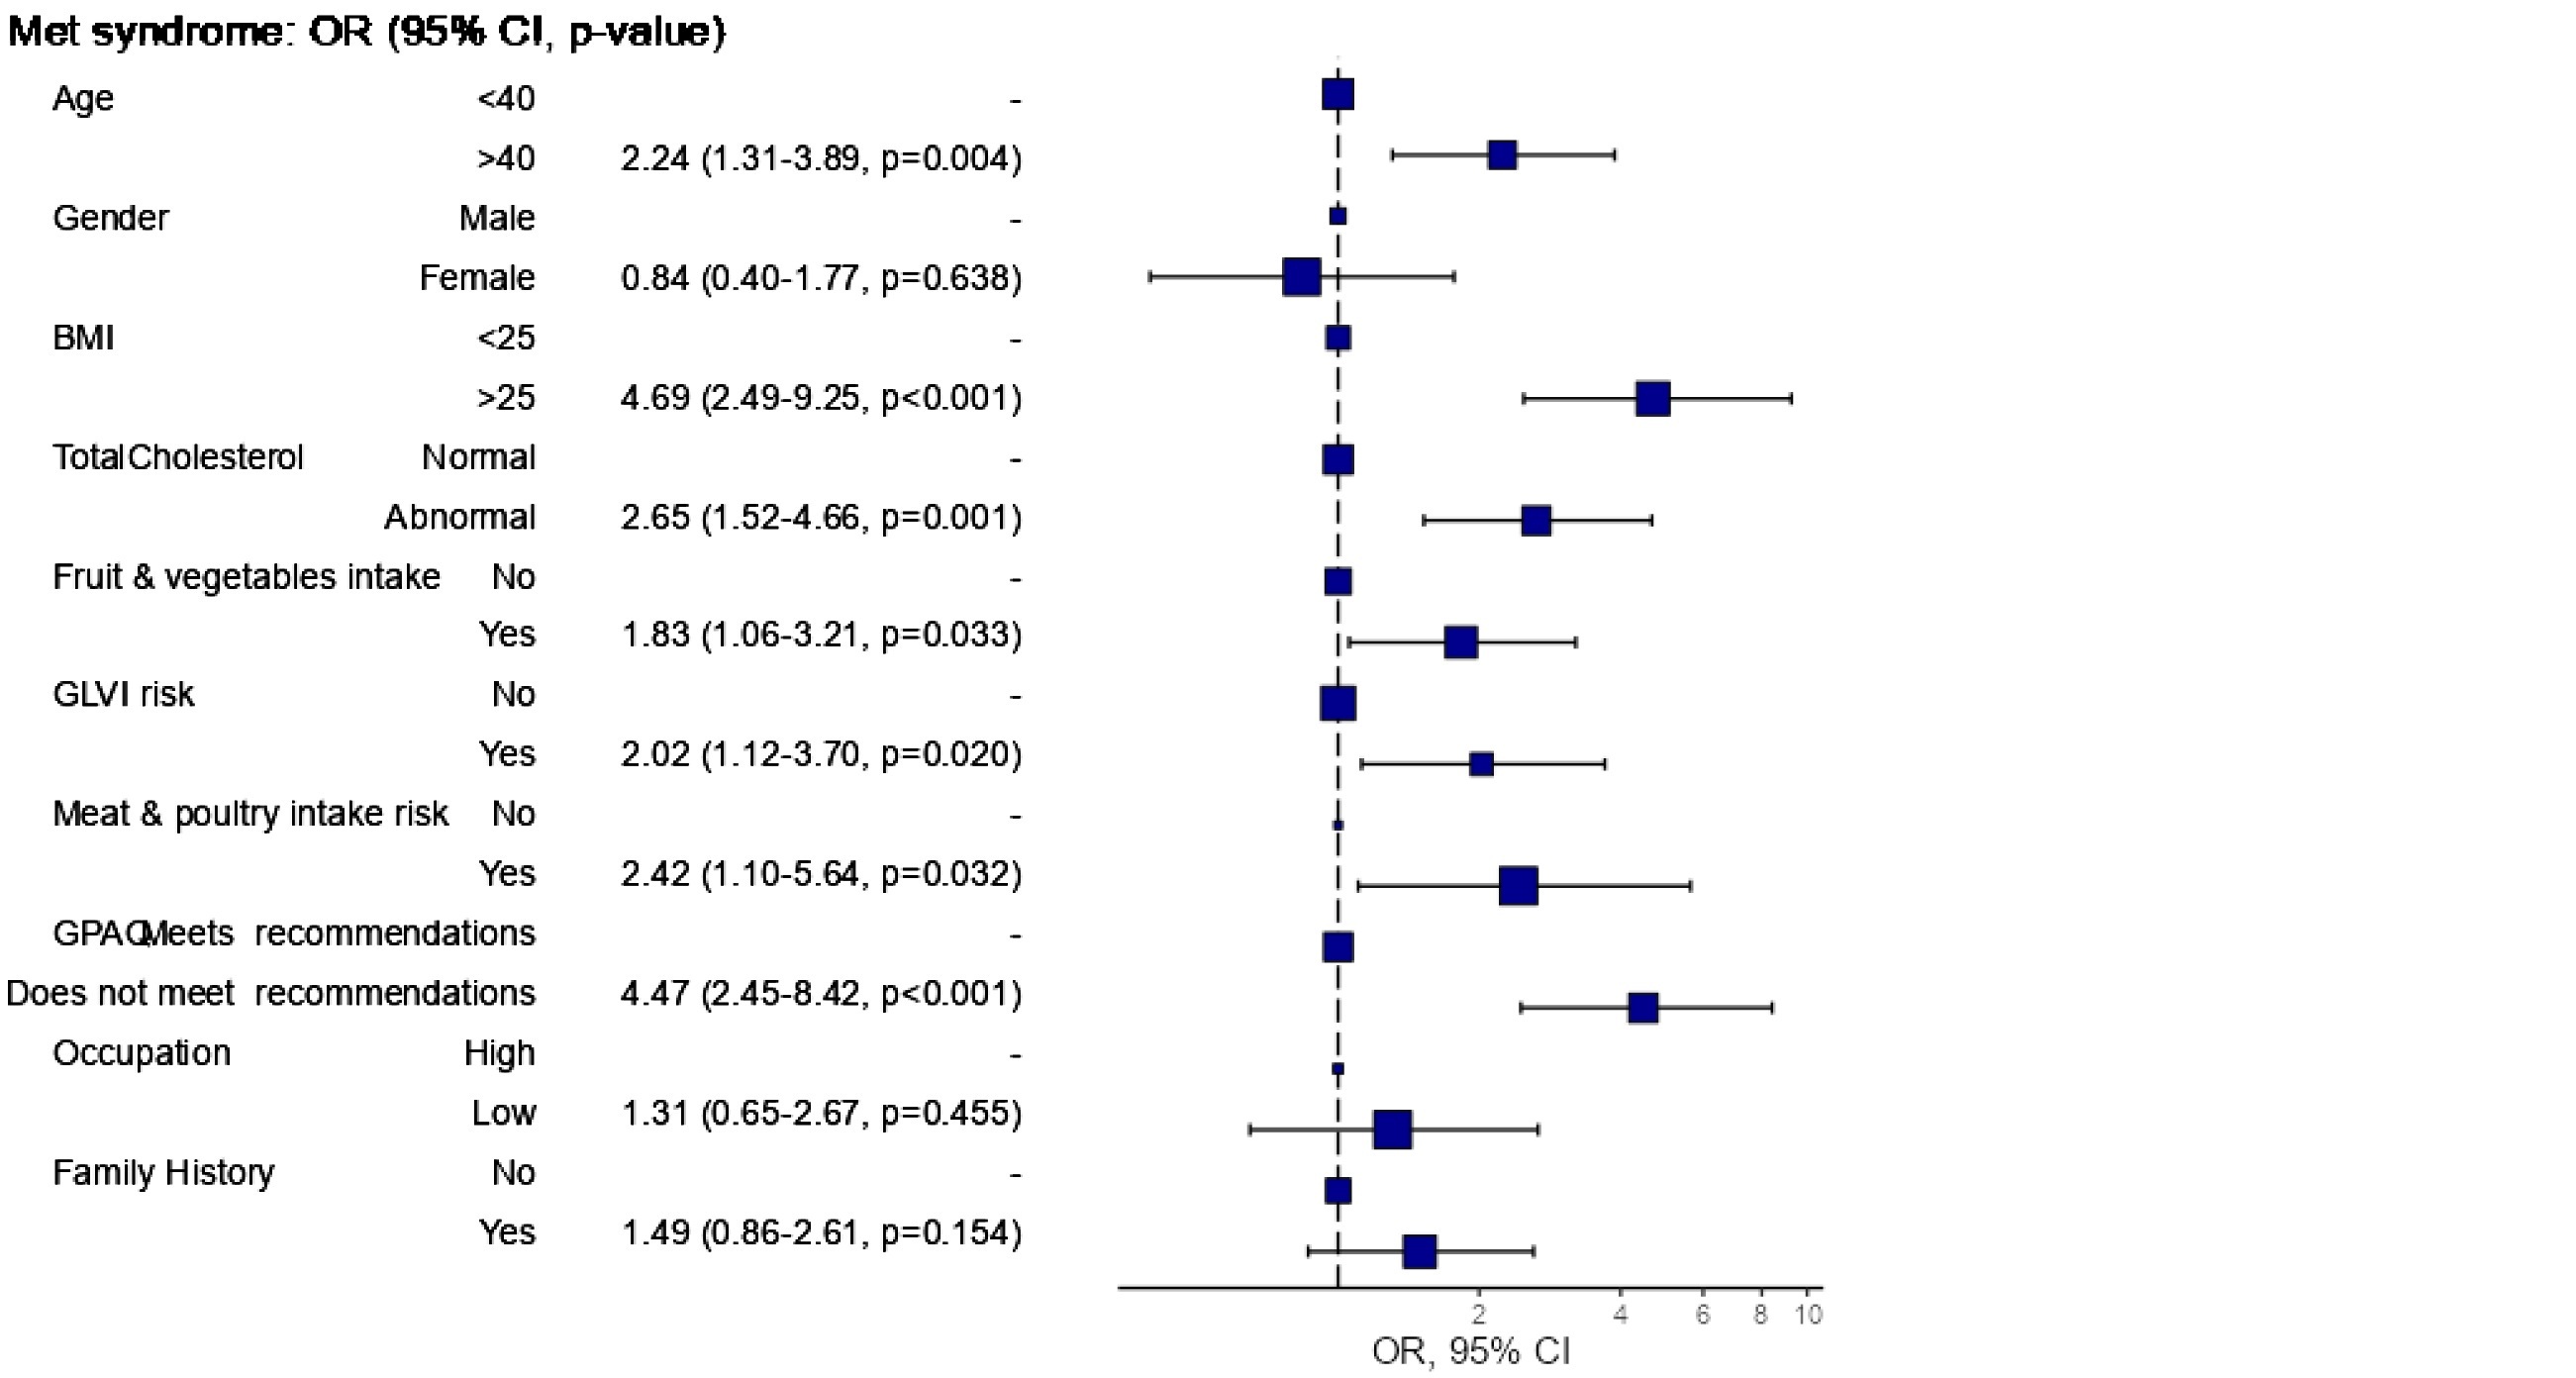
Figure 2: Odds ratio plot.
Discussion
The prevalence of metabolic syndrome (MS) in South India has become a pressing public health concern, especially in urban areas where lifestyle changes have led to increased rates of obesity, hypertension, and dyslipidemia. Recent studies indicate alarmingly high rates of MS in this region, with our research revealing a prevalence of 41.8% among adults, aligning with other recent studies.
According to the NCEP/ATP III guidelines, MS is characterized by criteria such as central obesity, elevated triglycerides, low HDL cholesterol, high blood pressure, and increased fasting plasma glucose levels. Our findings emphasize the multifactorial nature of MS, pointing to the significant influence of demographic factors like age and gender, as well as lifestyle choices and socioeconomic status.
A systematic review and meta-analysis by Krishnamoorthy et al found that the prevalence of MS in urban Indian populations is about 32%, with a marked increase among older adults[2]. This aligns with the present study results, which identified age as a critical risk factor, particularly for individuals over 40. The study also noted that urbanization has led to higher MS rates, as urban residents often adopt lifestyles that involve decreased physical activity and increased consumption of unhealthy foods.
Choudhury et al. (2018) conducted a systematic review and meta-analysis in Bangladesh, revealing a significant public health issue with varying prevalence rates, some studies reporting as high as 30% among adults [14]. The overall weighted pooled prevalence of MS was found to be 30.0%, with higher rates in females (32%) compared to males (25%), though this difference was not statistically significant. The highest prevalence (37%) was observed when using the Modified NCEP ATP III criteria, while the lowest (20%) was noted with the WHO criteria. Geographical differences between urban and rural areas were a significant source of variability in the findings.
A retrospective hospital-based study in Nepal (Shakya et al., 2021) indicated a prevalence of MS of 31.8% based on NCEP ATP III criteria, with a male predominance (52.5%) and a majority of participants from urban areas (84.8%)[15]. In Bahawalpur, Pakistan, Afzal et al. (2021) reported a prevalence of 34.7% for MS among adults, with a female majority (60%)[16]. The study identified lifestyle factors such as physical inactivity and poor dietary habits as major contributors, reinforcing the importance of lifestyle modifications in managing and preventing MS in South Asian populations.
Shin and Jee (2020) conducted a meta-analysis of the Gulf Cooperation Council (GCC) countries, finding a high prevalence of MS at 27.3% [17]. They highlighted regional disparities and the impact of common lifestyle factors, with Kuwait reporting the lowest prevalence (22.0%) and the UAE the highest (39.0%). Ambachew et al. (2020) performed a systematic review and meta-analysis in Ethiopia, revealing MS prevalence ranging from 10% to 40% across various studies[18]. Their findings indicated an upward trend in MS, particularly in urban populations, correlating with lifestyle changes. The pooled prevalence of MS in Ethiopia was 34.89% (95% CI: 26.77, 43.01) using the NCEP/ATP III criteria, with higher rates in females (34.09%) compared to males (24.82%). Subgroup analyses showed the highest prevalence among type 2 diabetes patients (63.78%) and hypertensive patients (44.55%).
Gouveia et al. (2021) analysed data from Amazonas, Brazil, reporting a prevalence of MS at 47.5%, with 52.2% among women and 39.6% among men [19]. Factors such as advanced age, female gender, higher body mass index, and lower educational levels were independently associated with increased odds of MS. This study emphasizes the need for early public health interventions in the Amazonas region and the importance of regional health surveys to understand the local burden of MS. Sigit et al. (2020) compared MS prevalence between middle-aged individuals in Indonesia and the Netherlands, finding higher rates in Indonesia (28% for men and 46% for women) compared to the Dutch population (19.2% overall)[20]. In Indonesia, hypertension (61%) and hyperglycaemia (51%) were the most prevalent components, while in the Netherlands, hypertension (62%) and abdominal obesity (40%) were more common. The study highlighted how cultural and lifestyle factors influence MS prevalence across countries.
Al-Rubeaan et al. (2018) conducted a cross-sectional study in Saudi Arabia, reporting a prevalence of MS at 39.8% (34.4% in men and 29.2% in women) using the NCEP ATP III criteria [21]. The prevalence increased with age, peaking in the sixth and seventh decades before declining. Significant risk factors included age ≥ 45, a history of smoking, low educational attainment, and urban residency. Lee et al. (2018) noted an increase in MS prevalence in South Korea from 28.4% in 2009 to 30.5% in 2013, registering an annual increase of 0.4% among adults, with lifestyle factors like diet and physical activity contributing to this rise [22].
Recent studies conducted in India have provided significant insights into the prevalence of metabolic syndrome among adults. The prevalence of MS in the Indian population varies widely based on geographical location, demographic factors, and lifestyle choices. In urban settings, the prevalence tends to be notably higher. A multicentric study conducted by Deedwania et al (2014) [23]. found that the prevalence of MS was 30.3% among males and 40.4% among females in 11 cities across India, indicating that urbanization and associated lifestyle factors, such as diet and physical activity, contribute significantly to the risk of developing MS. A cross-sectional study from a south Indian city (Nimisha et al ,2023) gives the overall prevalence of MS as 51.3% with an increased proportion among females (52.3%) compared to males (49.6%) [24]. A study by Sarma et al (2024) based on a sample of 540 subjects from urban area of Chhattisgarh shows the prevalence of metabolic syndrome as 55%[25]. The prevalence of the condition was greater among females, with 65% affected.
In summary, the parameter estimation of MS prevalence in India reveals a complex interplay of regional, socio-demographic, and health-related factors.
Factors associated with metabolic syndrome
The findings of this study highlight several critical risk factors associated with the development of metabolic syndrome (MS) in adults. The mean age of the study group with MS was 41.92±8.5 years and that of study group with no MS was 36.91±9.4 years. Age emerged as a significant risk factor, with individuals over 40 years exhibiting a notably higher odds ratio (OR) of 2.39 in the univariate analysis and 2.16 in the multivariate analysis, indicating that older age is strongly linked to the likelihood of developing MS. The study by Damiri et al. (2019) clearly demonstrates the role of age, gender, and body mass index [26]. Compared with the age group 18–20 years, MS was 5.6 times more prevalent in the age group 51–65 years and 2.6 times more prevalent in the age group 41–50 years. Men were less likely to have MS than women (OR 0.33). The role of BMI was noteworthy; those with a BMI ≥25 had a risk of MS of 19.89, and all these differences were significant.
In the present study body mass index was significantly associated with MS, with individuals having a BMI greater than 25 showing an OR of 7.64 in the univariate analysis and 4.90 in the multivariate analysis, confirming the important role of obesity in the risk of developing MS. A nationally representative study by Li Y et al. (2018) also highlights the role of age, BMI, and physical activity [27]. The mean age of normal subjects was 49.9 ± years, while that of MS cases was 56.5 ± 12.5 years. The mean BMI in these groups was 22.6 and 26.3, respectively. The level of physical activity was high/very high in 50.7% of the normal subjects and 46.0% in the MS group, with these differences being significant.
Gender differences were observed in the present study, with females initially showing a higher prevalence of MS (OR = 1.69) in the univariate analysis; however, this association did not persist in the multivariate analysis (OR = 0.82), suggesting that gender may not be an independent risk factor when controlling for other variables. In the study by Pavithra and Naik (2023) conducted among Indian adults, it was found that those aged ≥50 years had a 2.3 times higher risk of MS compared to those aged 18-49 years [28]. The risk was lower among physically active individuals (OR = 0.97), while females had a 2.3 times higher risk of developing MS.
Abnormal total cholesterol levels significantly associated with MS, yielding an OR of 3.08 in the univariate analysis and 2.68 in the multivariate analysis. In a study conducted among students and staff at Bangladesh University (Ali et al., 2023), increased age (OR = 3.84 in 20-21 years to OR = 13.49 in >23 years), BMI (OR = 9.78 for obese), hypertension (OR = 33.0), dyslipidemia (OR = 21.9), low physical activity (OR = 4.45), and smoking (OR = 4.31) were significantly associated with MS in students [29]. In academic staff, increased age (OR = 1.3 in 31-40 years to OR = 2.33 in those above 50 years), BMI (OR = 4.92 for obese), hypertension (OR = 1.7), and dyslipidemia (OR = 12.7) were also significantly associated with MS. Elevated total cholesterol, particularly in the context of obesity and unhealthy lifestyle choices, is a crucial factor in the development of metabolic syndrome (MS). A systematic review by Mardi et al. (2022) highlighted a significant link between novel atherogenic lipid indices and the risk of MS and its individual components [30]. Indices such as the atherogenic index, Diff-c, and non-HDL-C demonstrated considerable predictive value. Specifically, increased non-HDL-C levels were associated with a 3.7-fold higher likelihood of developing MS, according to the Adult Treatment Panel criteria. The study also estimated the odds ratio for MS in adults to be 3.53.
Nimisha et al. (2023) investigated the effectiveness of the triglyceride-to-HDL-C ratio (TG/HDL-C) as a biomarker for MS. Their findings indicated a mean TG/HDL-C ratio of 2.6±1.8 in individuals without MS, compared to 5.3±3.1 in those with the condition. Receiver operating characteristic (ROC) curve analysis revealed high diagnostic accuracy, with an area under the curve (AUC) of 0.85. At a cutoff value of 2.6, the TG/HDL-C ratio showed 90% sensitivity and 60% specificity for identifying MS.
Further supporting this association, a cross-sectional study by Srivastav et al. (2022) examined the relationship between dyslipidemia and the severity of MS as defined by the NCEP ATP-III criteria [31]. The prevalence of dyslipidemia, defined by triglyceride levels ≥150 mg/dL, increased progressively with the number of MS components, rising from 45.0% in individuals with three components to 68.4% in those with four, and reaching 100% in those with all five components. Similarly, dyslipidemia characterized by low HDL-C levels (<40 mg/dL in males and <50 mg/dL in females) was found in 45.7%, 75.7%, and 100% of individuals with three, four, and five components of MS, respectively.
The present study shows other lifestyle factors also contributed to the risk of metabolic syndrome. Individuals who did not meet the GPAQ recommendations had a significantly higher risk of MS, with odds ratios of 3.80 and 4.34 in the respective analyses. The study by Park et al. (2022) shows the association between lifestyle factors and MS [32]. In this study, the risk of MS increased steadily as the number of abnormal lifestyle factors increased, with ORs of 1.28 for two risk factors and 1.97 when four risk factors were present for males. A similar pattern was observed for females, with the prevalence ratios (PR) being 1.08, 1.94, and 2.58 for two, three, and four risk factors, respectively.
Dietary habits played a crucial role, with inadequate fruit and vegetable intake linked to an increased risk with OR = 1.62 in univariate analysis and OR=1.76 in multivariable analysis, and risky meat and poultry consumption showing an OR of 3.61 in the univariate analysis and 2.44 in the multivariate analysis. The role of diet in the control of MS was clearly demonstrated by McGrath and Fernandez (2022) [33]. In patients with MS, the intervention involved following a plant-based diet (PBD). Baseline data showed that the healthful PBD index was inversely associated with body weight, while the unhealthful PBD index was positively associated. At follow-up after two weeks, the mean weight was significantly lower in the highest quintile of the healthful PBD index compared to the lowest quintile. Conversely, the mean weight was higher in the highest quintile of the unhealthy PBD index compared to the lowest quintile. HDL-C was positively associated with the healthful PBD and negatively associated with the unhealthful PBD index, with all these differences being significant.
The harmful effects of red meat and processed meat on MS have been established by Kim and Je (2018) [34]. This meta-analysis shows that the pooled relative risk (RR) for metabolic syndrome for the highest versus lowest category of meat intake was 1.14 for total meat, 1.33 for red meat, 1.35 for processed meat, and 0.86 for white meat. The association of MS with meat, fish, and eggs was highlighted by the study by Hidayat et al. (2021) [35]. In this cross-sectional study and accompanying meta-analysis, red meat consumption was positively associated with MS, while fish consumption was inversely associated, and poultry consumption was neutrally associated. The multivariable-adjusted OR for the highest versus lowest quartiles of consumption was 1.23 for red meat, 0.83 for fish, and 0.93 for poultry. In the meta-analysis, the pooled RR for the highest versus lowest categories of consumption was 1.20 for red meat, 0.88 for fish, and 0.97 for poultry.
A meta-analysis by Shu and Si (2023) demonstrates that the consumption of ultra-processed food is associated with MS [36]. The pooled effect size for the highest versus lowest categories of ultra-processed food consumption indicated a positive association with the risk of MS (RR = 1.25). Subgroup analyses revealed a positive association between the consumption of ultra-processed food and MS risk in cross-sectional studies (RR = 1.47) and no significant association in cohort studies (RR = 1.10).
Conclusions
This study underscores the multifaceted nature of MS, highlighting age, BMI, dietary habits, and physical activity levels as key risk factors. The findings point to the necessity of targeted public health initiatives aimed at encouraging healthier lifestyle choices and facilitating early detection through regular screenings. By addressing these areas, health authorities can significantly reduce the burden of MS and improve community health outcomes. Furthermore, continued research is crucial to explore socio-cultural influences on MS and to design effective, population-specific interventions that address this increasing health challenge. Acknowledgments The authors acknowledge the support provided by the Medical officer and staff of FHC, Pangappara. This research is funded by State Board of Medical Research, Government of Kerala.
Conflicts of interest
Authors declare no conflicts of interest
References
[1] Basu S, Thirunavukarasu AJ, Maheshwari V, Zode M, Hassan R. Burden, determinants and treatment status of metabolic syndrome among older adults in India: a nationally representative, community–based cross–sectional survey. BMJ Public Health. 2023; 1:e000389.
[2] Krishnamoorthy Y, Rajaa S, Murali S, Rehman T, Sahoo J, et al. Prevalence of metabolic syndrome among adult population in India: a systematic review and meta–analysis. PLOS One. 2020; 15:e0240971.
[3] Pati M, Chandra K. The scenario of metabolic syndrome in India: a systematic review and meta–analysis. Annals of Anthropological Research & Reviews Vol. 2023; 22.
[4] Zila–Velasque JP, Grados–Espinoza P, Challapa–Mamani MR, Sánchez–Alcántara F, Cedillo–Balcázar J, et al. Prevalence of metabolic syndrome and its components according to altitude levels: a systematic review and meta–analysis. Scientific Reports. 2024; 14:27581.
[5] Venugopal V, Dongre AR, Saravanan S. Prevalence and determinants of metabolic syndrome among the rural adult population of Puducherry. Indian J Community Med. 2019 ;44:21–25.
[6] Shankar E. Metabolic Syndrome: Modern India’s Biggest Botheration and Concern. Annals of SBV. 2023; 12:1–2.
[7] Banerjee P, Reddy GB, Panda H, Angadi KK, Reddy T, et al. Diets, lifestyles and metabolic risk factors among corporate information technology (IT) employees in South India. Nutrients. 2023; 15:3404.
[8] Yuan SQ, Liu YM, Liang W, Li FF, Zeng Y, et al. Association between eating speed and metabolic syndrome: a systematic review and meta–analysis. Frontiers Nutrition. 2021; 8:700936.
[9] Ismael SA. Effects of low carbohydrate diet compared to low fat diet on reversing the metabolic syndrome, using NCEP ATP III criteria: a randomized clinical trial. BMC Nutrition. 2021; 7:1–9.
[10] Lee J. Associations of relative handgrip strength and aerobic and strength exercises with metabolic syndrome prevalence. Int J Environ Res Public Health. 2022; 19:14646.
[11] Hua J, Jiang H, Wang H, Fang Q. Sleep duration and the risk of metabolic syndrome in adults: a systematic review and meta–analysis. Frontiers Neurol. 2021; 12:635564.
[12] Elshoeibi AM, Akomolafe A, Al–Khulaifi A, Metwally O, Al–Khayarin R, et al. The association between short sleep duration and metabolic syndrome: A case–control study. Diabet Metabol Synd Obesit. 2023; 16:4157–4167.
[13] National Cholesterol Education Program : Expert panel on detection and treatment of high blood cholesterol in adults. Third Report of the National Cholesterol Education Program (NCEP) expert panel on detection, evaluation, and treatment of high blood cholesterol in adults (Adult Treatment Panel III) final report. Circulation. 2002; 106:3143–3421.
[14] Chowdhury MZ, Anik AM, Farhana Z, Bristi PD, Abu Al Mamun BM, et al. Prevalence of metabolic syndrome in Bangladesh: a systematic review and meta–analysis of the studies. BMC Public Health. 2018; 18:1–4.
[15] Shakya YL, Raut S, Shrestha TM, Neupane RP. Prevalence of metabolic syndrome among subjects attending general health checkup of a tertiary center of Kathmandu, Nepal. J Inst Med Nepal. 2021; 43.
[16] Afzal K, Zeb N, Humayun F, Hashmi J, Asad M , et al. Prevalence of metabolic syndrome and their associated risk factors amongst adults in district bahawalpur. PJMHS. 2022; 15:4003–4007.
[17] Shin S, Jee H. Prevalence of metabolic syndrome in the Gulf Cooperation Council countries: meta–analysis of cross–sectional studies. J Exerc Rehabil. 2020; 16:27–35.
[18] Ambachew S, Endalamaw A, Worede A, Tegegne Y, Melku M, et al. The prevalence of metabolic syndrome in ethiopian population: A systematic review and meta‐analysis. J Obes. 2020; 2020:2701309.
[19] Gouveia ER, Gouveia BR, Marques A, Peralta M, Franca C, et al. Predictors of metabolic syndrome in adults and older adults from Amazonas, Brazil. Int J Environ Res Public Health. 2021; 18:1303.
[20] Sigit FS, Tahapary DL, Trompet S, Sartono E, Willems van Dijk K, et al. The prevalence of metabolic syndrome and its association with body fat distribution in middle–aged individuals from Indonesia and the Netherlands: a cross–sectional analysis of two population–based studies. Diabetol Metabol Syndr. 2020; 12:1–1.
[21] Al–Rubeaan K, Bawazeer N, Al Farsi Y, Youssef AM, Al–Yahya AA, et al. Prevalence of metabolic syndrome in Saudi Arabia–a cross sectional study. BMC Endocr Disord. 2018; 18:1–9.
[22] Lee SE, Han K, Kang YM, Kim SO, Cho YK, et al. Trends in the prevalence of metabolic syndrome and its components in South Korea: Findings from the Korean National Health Insurance Service Database (2009–2013). PloS one. 2018; 13:e0194490.
[23] Deedwania PC, Gupta R, Sharma KK, Achari V, Gupta B, et al. High prevalence of metabolic syndrome among urban subjects in India: a multisite study. Diabet Metabol Syndr: Clinical Res Review. 2014; 8:156–161.
[24] Nimisha V, Raghunath H, Devasia D, Drisya M. Triglyceride glucose index and triglyceride/HDL cholesterol as predictors of metabolic syndrome in adult population in Mandya City, Karnataka. J Chemical Health Risks. 2023; 13:46–52.
[25] Sharma V, Deissuza D, Parveen N. Prevalence of metabolic syndrome among the urban population of Bilaspur: A cross–sectional study. Eur J Cardiovascul Med. 2024; 14: 279 – 284.
[26] Damiri B, Badran L, Safadi D, Sawalha A, Yasin Y, et al. Metabolic syndrome and related risk factors among adults in the northern West Bank, a cross–sectional study. Int Health. 2022; 14:339–345.
[27] Li Y, Zhao L, Yu D, Wang Z, Ding G. Metabolic syndrome prevalence and its risk factors among adults in China: A nationally representative cross–sectional study. Plos One. 2018; 13:e0199293.
[28] Pavithra H, Naik PR. Prevalence of metabolic syndrome and its risk factors among adults in a rural area of Dakshina Kannada District. Indian J Community Med. 2023; 48:861–866.
[29] Ali N, Samadder M, Shourove JH, Taher A, Islam F. Prevalence and factors associated with metabolic syndrome in university students and academic staff in Bangladesh. Scient Report. 2023; 13:19912.
[30] Mardi P, Abdi F, Ehsani A, Seif E, Djalalinia S, et al. Is non–high–density lipoprotein associated with metabolic syndrome? A systematic review and meta–analysis. Frontiers Endocrinol. 2022; 13:957136.
[31] Srivastav SK, Mir IA, Bansal N, Singh PK, Kumari R, et al. Serum ferritin in metabolic syndrome—mechanisms and Clinical Applications. Pathophysiology. 2022; 29:319–325.
[32] Park YS, Kang SH, Jang SI, Park EC. Association between lifestyle factors and the risk of metabolic syndrome in the South Korea. Scient Report. 2022; 12:13356.
[33] McGrath L, Fernandez ML. Plant–based diets and metabolic syndrome: Evaluating the influence of diet quality. J Agricul Food Res. 2022; 9:100322.
[34] Kim Y, Je Y. Meat consumption and risk of metabolic syndrome: Results from the Korean population and a meta–analysis of observational studies. Nutrient. 2018; 10:390.
[35] Hidayat K, Zhu WZ, Peng SM, Ren JJ, Lu ML, et al. The association between meat consumption and the metabolic syndrome: a cross–sectional study and meta–analysis. British J Nutrition. 2022; 127:1467–1481.
[36] Shu L, Zhang X, Zhou J, Zhu Q, Si C. Ultra–processed food consumption and increased risk of metabolic syndrome: a systematic review and meta–analysis of observational studies. Frontiers in nutrition. 2023;10:1211797.