Full Text
Introduction
Skin is the largest organ in the body, accounting for about 15% of the total body weight in adult humans. It is a complex organ in which precisely regulated cellular and molecular interaction oversee many crucial responses to our environment [1].
Sir Paul Ehlrlich, devised the term mast cells to describe the aniline reactive granular cells found in connective tissues. Mast cells derive from precursors in bone marrow [2] and mature under tissue environmental factors [3]. Mast cell is a fundamental cellular component of skin and responds to varied range of stimuli including neuronal impulses, allergens, antigens, hormones, cytokines from T cells and keratinocytes and thus play a role in manifestation of dermatological disorders.
Mast cells are found in all levels of skin including dermis, around blood vessels, nerves, appendages, at dermoepidermal junction (DEJ) and also in subcutaneous tissue [4]. Mast cells generate or release cytokines which are likely to play a key role in diverse pathophysiological processes such as chronic inflammatory processes, wound healing, angiogenesis, fibrosis and in addition tumors. The metachromatic staining property of granules in the mast cell cytoplasm can be utilized to detect them in skin biopsies using Toluidine blue stain [5]. Tissue mast cell number, distribution and morphology vary in different skin lesions depending on the degree of mast cell activation and may have a bearing on diagnosis.
The objective was to study mast cell density in various subsets of Hansen’s disease and analyse whether the distribution and density vary amongst the subsets.
Materials and methods
Prospective study conducted at the Department of Pathology, MVJMC & RH, Hoskotte, Karnataka after obtaining ethical committee approval from July 2021 to June 2022. A total of 70 skin biopsies were included in study out of which 60 had a provisional diagnosis of leprosy and 10 biopsies were control taken from normal appearing skin.
Skin biopsies received were fixed in 10% formalin and processed by routine paraffin embedding technique. The overlying skin from surgical specimens received at the Department of Pathology were taken as control.
Two sections were obtained from each block, one stained with Hematoxylin and Eosin (H&E) and other stained with freshly prepared Toluidine blue. Histopathological diagnosis was made on H&E stained sections taking into account the clinical scenario. Hansen’s disease was classified based on the Ridley and Jopling classification. The mast cell density was assessed in 10 consecutive fields on toluidine stained sections on light microscopy employing Lawrence & Mayo N-204 model microscope using 40x objective and 10X eyepiece.
With these specifications and the magnification of 400x and field view diameter of 0.45mm, the area of the field was calculated as, a= 3.14×0.225×0.225=0.1589sq mm. Mast cells were further evaluated for their location in respective zones (i.e, perivascular, adnexal and interstitial locations). Mast cell status was evaluated and compared with normal skin biopsies. Correlation of mast cell distribution and density in the various subsets of Hansen’s was done. Statistical analysis was done using SPSS software version 21. The association was measured by Student’s-t test, P value <0.05 was taken as statistically significant.
Results
A total of 60 Leprosy skin biopsies received at the Department of Pathology were studied for the mast cell density, distribution and morphology. 10 control slides were also studied for mast cell density, distribution and morphology.
Leprosy was found to be more common in males (44) than in females (16) with a male to female ration of 2.75: 1. Maximum number of cases were in the age range of 41-50 yrs (22).
The most common lesion encountered was the borderline tuberculoid (Figure 1a,b) and borderline lepromatous (Figure 2a,b) followed by midborderline, ENL (Figure 3a,b), lepromatous leprosy (Figure 4a,b) and indeterminate. The least common lesion was tuberculoid leprosy (Figure 5) (Table 1).
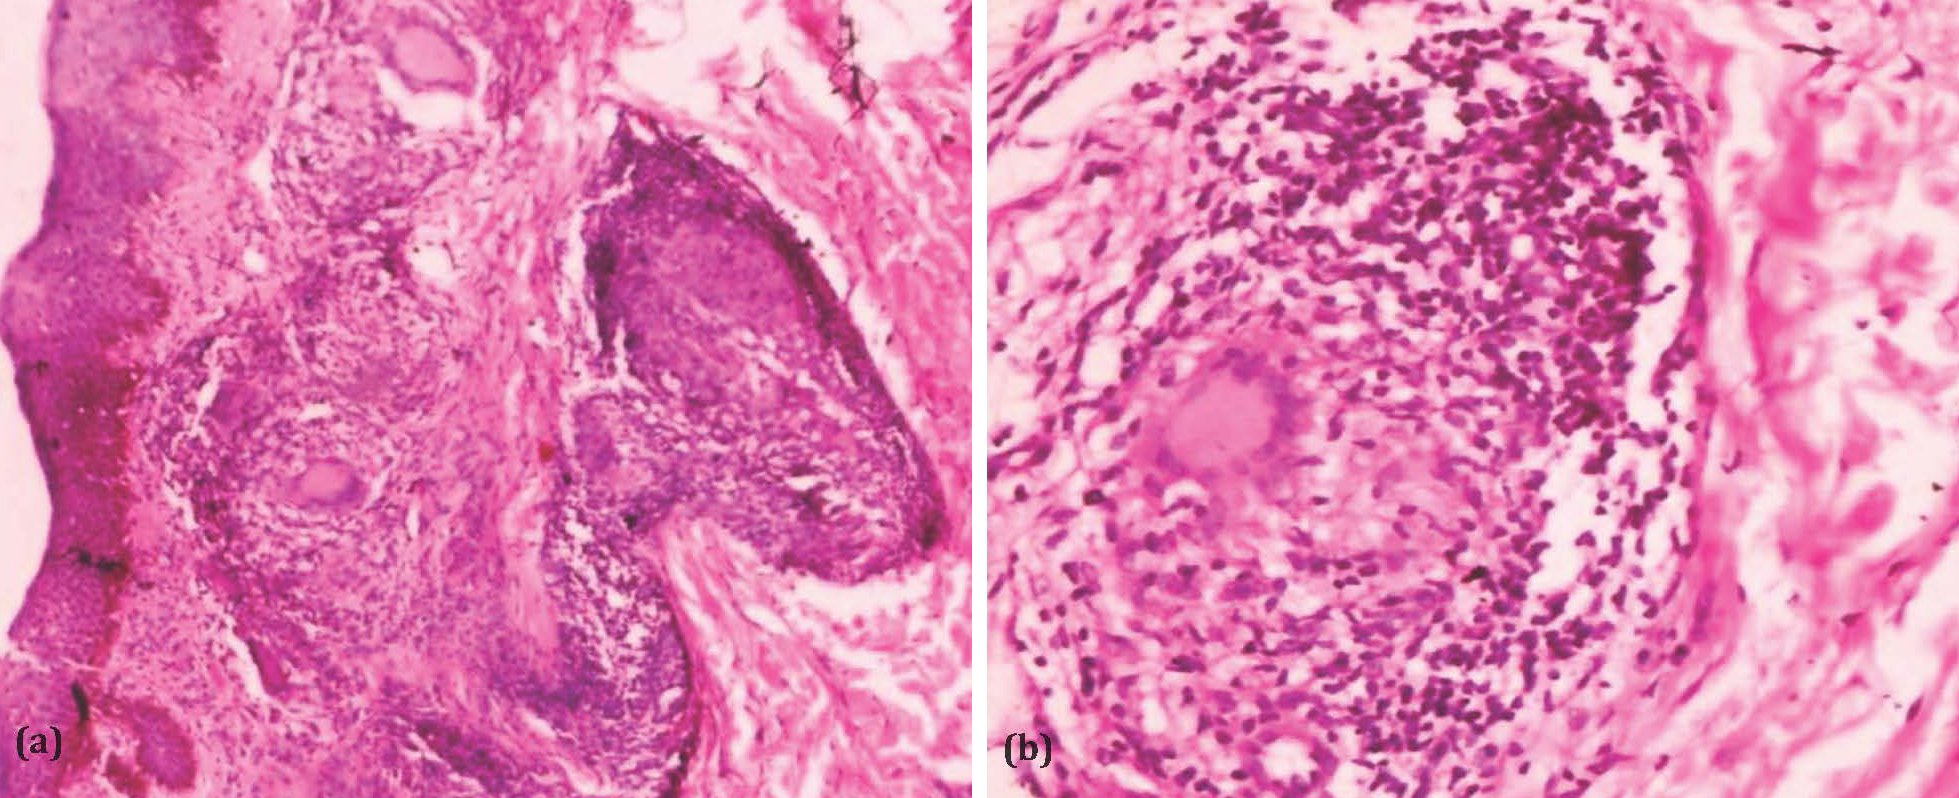
Figure 1: (a) Photomicrograph of borderline tuberculoid leprosy with granulomas (H&EX100), (b) Photomicrograph of borderline tuberculoid showing granulomas composed of epithelioid cells, giant cells and lymphocytes (H&EX400).
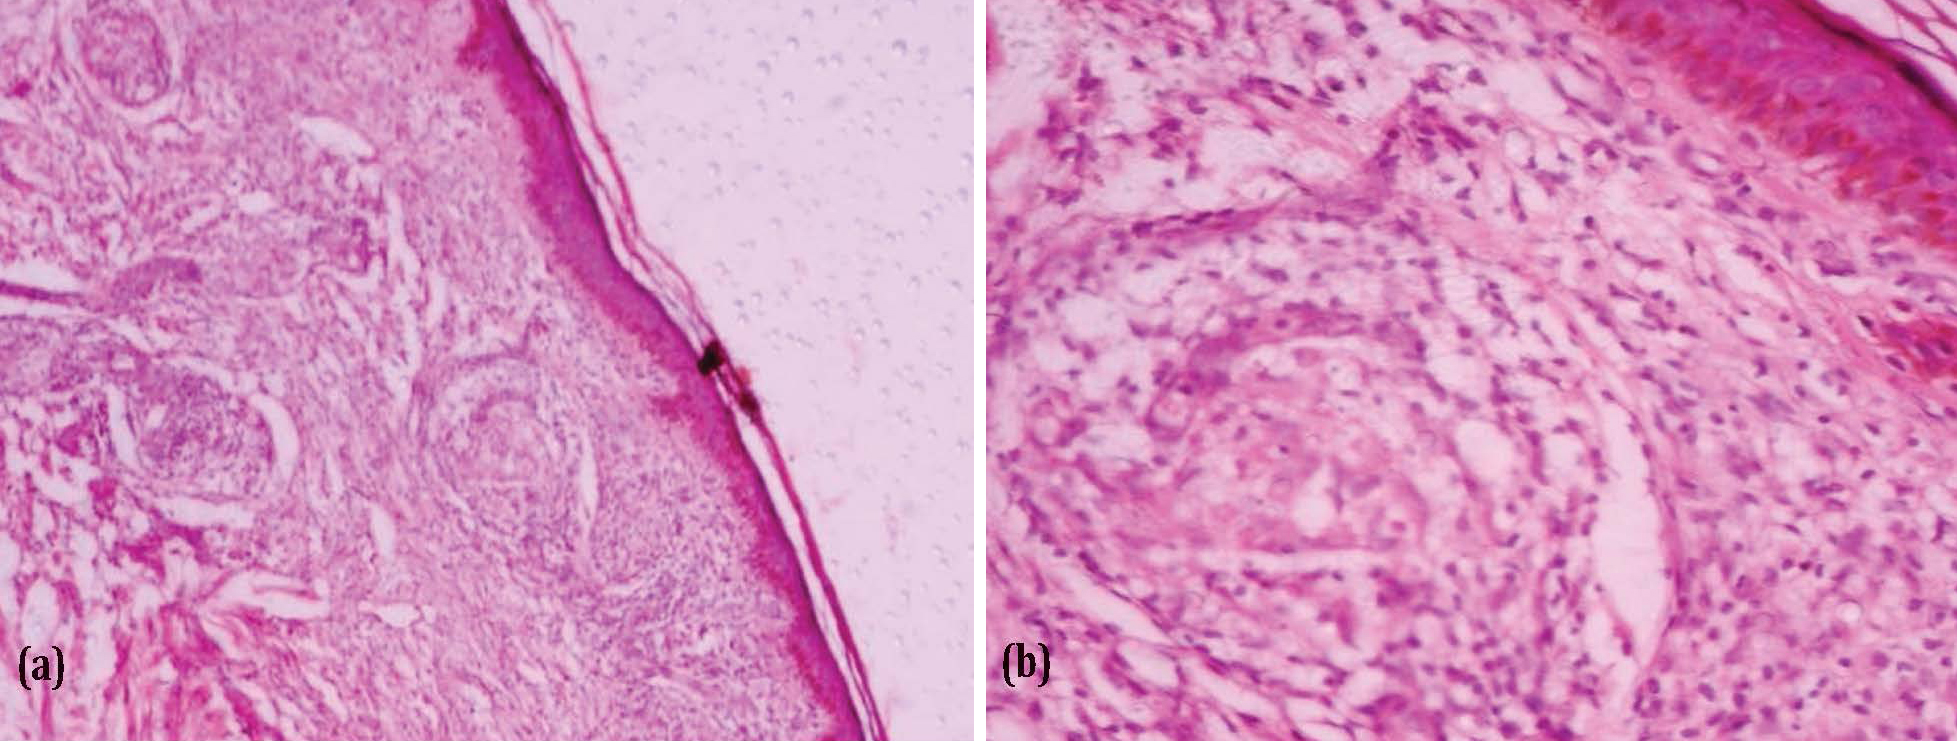
Figure 2: (a) Photomicrograph of borderline lepromatous leprosy with grenz zone (H&EX100), (b) Photomicrograph of borderline lepromatous leprosy with perivascular lymphohistiocytic infiltrate (x400).
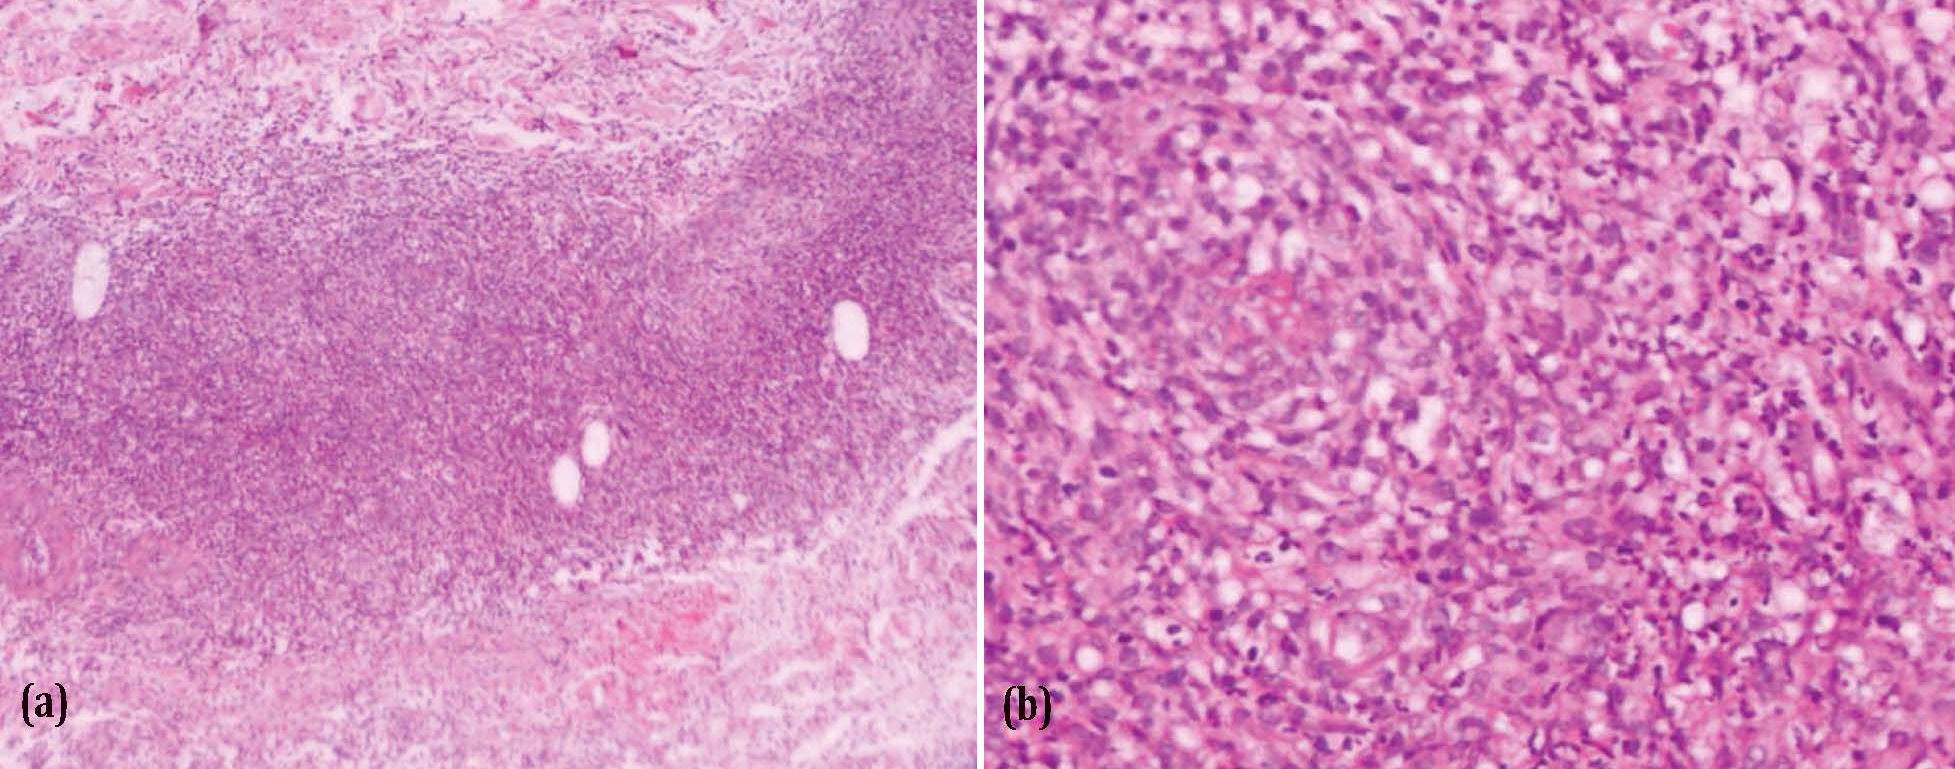
Figure 3: (a) Photomicrograph of ENL showing periadnexal, perivascular and perineural inflammatory infiltrate (H&EX100), (b) Photomicrograph of ENL showing inflammatory infiltrate composed of lymphocytes, histiocytes and neutrophils (H&EX400).
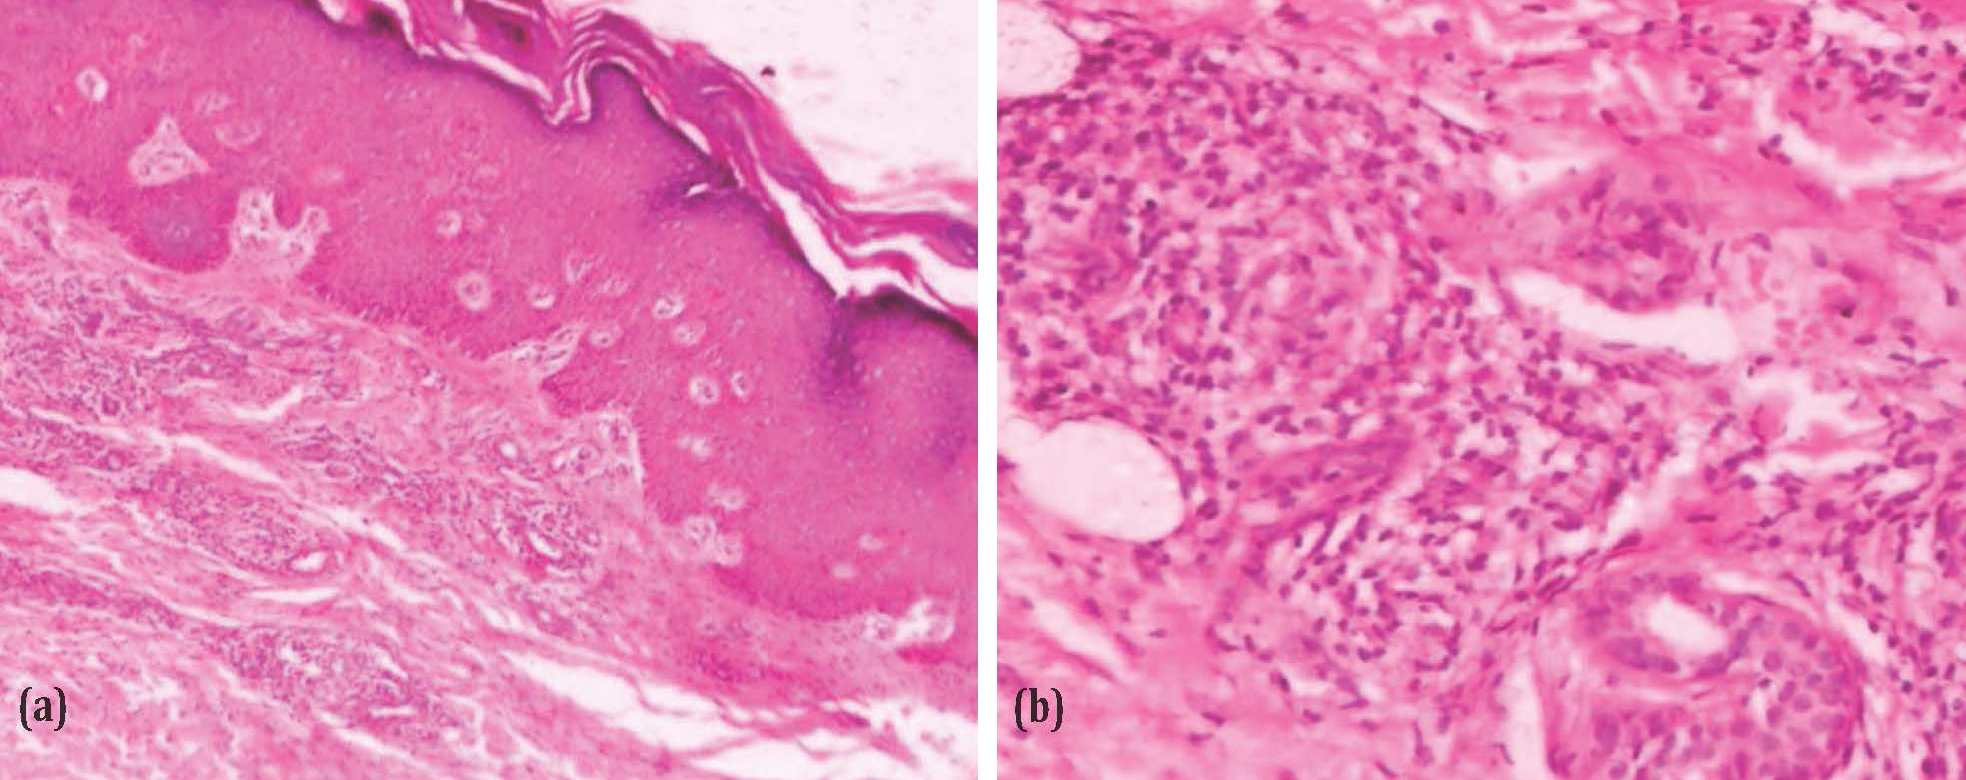
Figure 4: (a) Photomicrograph of lepromatous leprosy with Grenz zone (H&Ex100), (b) Photomicrograph of lepromatous leprosy with periadnexal lymphohistiocytic infiltrate (H&EX400).
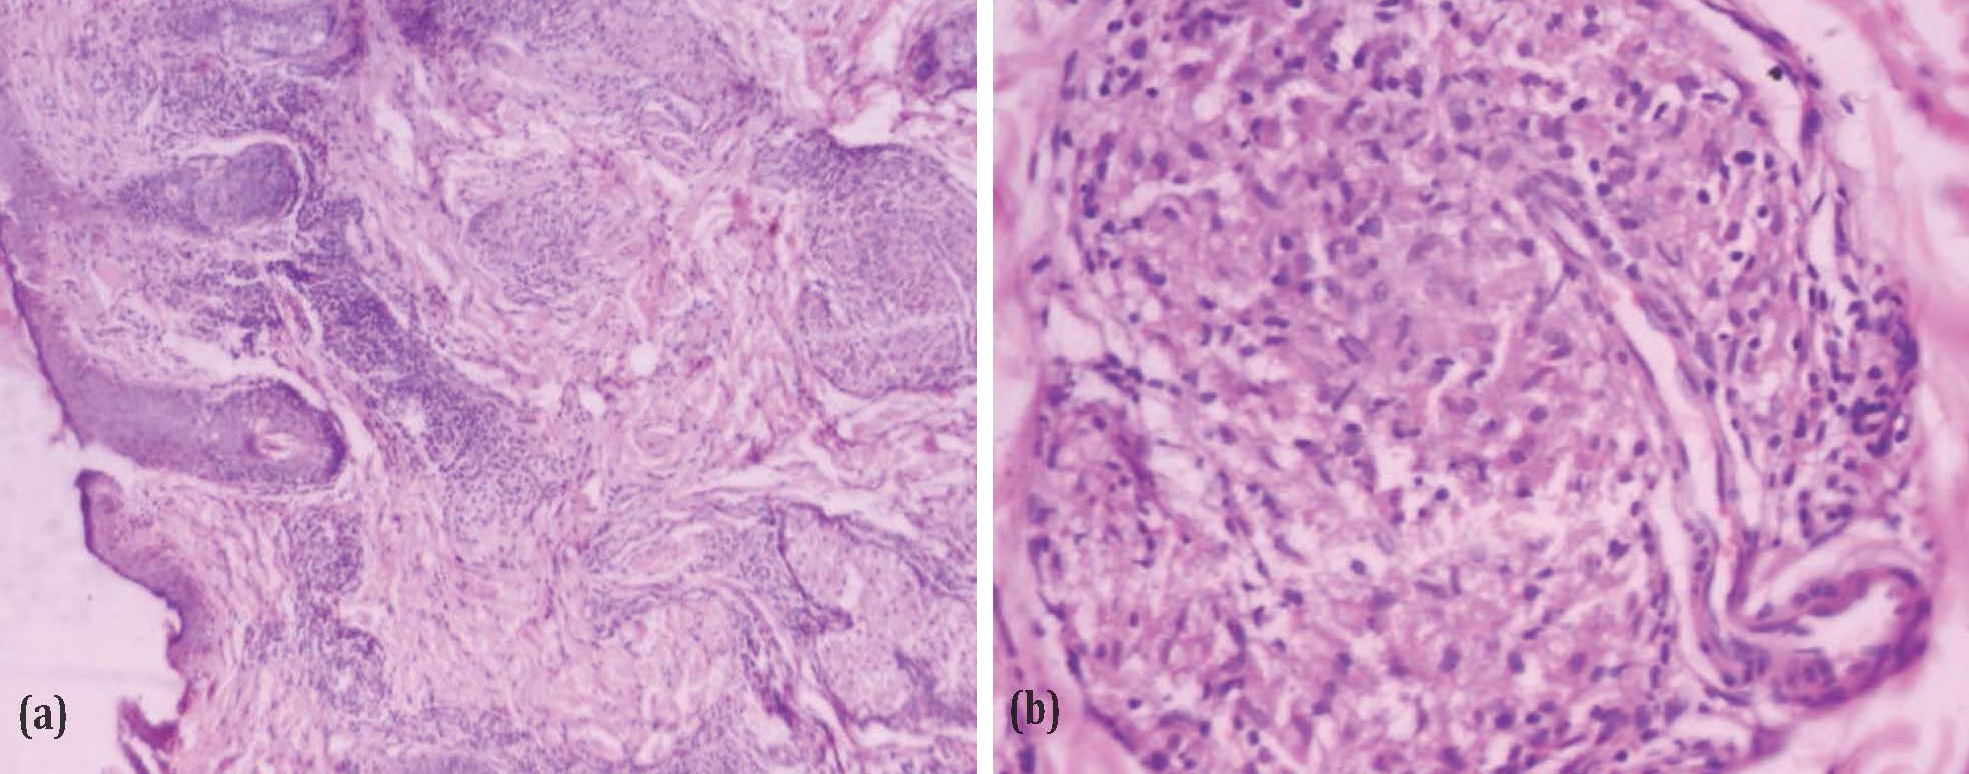
Figure 5: (a) Photomicrograph of tuberculoid leprosy with well-formed granulomas (H&EX100), (b) Photomicrograph of granuloma composed of epithelioid cells and lymphocytes (H&Ex400).
Table 1: Distribution of leprosy lesions.
|
Disorder
|
No.
|
Percentage (%)
|
|
Indeterminate leprosy
|
6
|
10
|
|
Lepromatous leprosy
|
8
|
13.3
|
|
Tuberculoid leprosy
|
2
|
3.3
|
|
Midborderline
|
10
|
16.7
|
|
Borderline tuberculoid
|
12
|
20
|
|
Borderline lepromatous
|
12
|
20
|
|
Erythema nodosum leprosum (ENL)
|
10
|
16.7
|
The highest mean mast cell count was noted in lepromatous leprosy (66/mm2), followed by erythema nodosum leprosum(42.6/mm2) and borderline lepromatous (40.8/mm2) (Table 2).
Table 2: Mean mast cell count in leprosy lesions.
|
Disorder
|
Mean mast cell count/mm2
|
SD
|
p value
|
|
Indeterminate leprosy
|
21
|
9.84885
|
0.0093
|
|
Lepromatous leprosy
|
66
|
16.89181
|
<0.0001
|
|
Tuberculoid leprosy
|
38
|
-
|
-
|
|
Midborderline
|
31.4
|
9.96493
|
<0.0001
|
|
Borderline tuberculoid
|
33.6
|
12.84783
|
0.0001
|
|
Borderline lepromatous
|
40.8
|
6.58533
|
<0.0001
|
|
Erythema nodosum leprosum (ENL)
|
42.6
|
18.36573
|
0.0001
|
|
Control
|
8.7
|
4.64399
|
-
|
The mean mast cell count in case of indeterminate leprosy, lepromatous leprosy, borderline lepromatous leprosy, borderline tuberculoid leprosy and erythema nodosum leprosum was significantly higher than that of the controls.
When the mast cell density among the two basic groups of leprosy (lepromatous leprosy with borderline lepromatous & tuberculoid leprosy with borderline tuberculoid) was compared the mast cells in tuberculoid group was significantly lower than that of the lepromatous group (Table 3).
Table 3: Mean mast cell count of lepromatous and tuberculoid leprosy.
|
Disorder
|
Mean mast cell count/mm2
|
SD
|
p value
|
|
Lepromatous (LL+BL)
|
50.9
|
16.97351
|
0.0418
|
|
Tuberculoid (TT+BT)
|
34.3
|
11.84222
|
The distribution of mast cells was within and around the granulomata in tuberculoid and borderline tuberculoid leprosy, while they were periadnexal and perivascular in location in other cases (Table 4).
Table 4: Distribution of mast cells in leprosy lesions.
|
Disorder
|
Granulomata
|
Periadnexal
|
Perivascular
|
Periadnexal
and
perivascular
|
|
Indeterminate leprosy
|
-
|
-
|
-
|
6
|
|
Lepromatous leprosy
|
-
|
6
|
-
|
2
|
|
Tuberculoid leprosy
|
2
|
-
|
-
|
-
|
|
Midborderline
|
-
|
-
|
-
|
10
|
|
Borderline tuberculoid
|
12
|
-
|
-
|
-
|
|
Borderline lepromatous
|
-
|
10
|
-
|
2
|
|
Erythema nodosum leprosum (ENL)
|
-
|
2
|
-
|
8
|
The most commonly encountered morphology of mast cells in Leprosy lesions is ovoid (Table 5).
Table 5: Morphology of mast cells in leprosy.
|
Disorder
|
Ovoid
|
Spindle
|
Ovoid & spindle
|
|
Indeterminate leprosy
|
4
|
-
|
2
|
|
Lepromatous leprosy
|
6
|
-
|
2
|
|
Tuberculoid leprosy
|
2
|
-
|
-
|
|
Midborderline
|
8
|
-
|
2
|
|
Borderline tuberculoid
|
8
|
2
|
2
|
|
Borderline lepromatous
|
8
|
2
|
2
|
|
Erythema nodosum leprosum (ENL)
|
8
|
-
|
2
|
Discussion
In the present study the most commonly encountered leprosy lesions were borderline tuberculoid leprosy and borderline lepromatous leprosy. Similar results were obtained in a study by Chatura et al [6]. The age of the patients ranged from 6 to 80 years with majority of the patients in the age range of 21 to 50 years. A study by Jindal et al [7] demonstrated similar results.
The Male: Female ratio in case of leprosy lesions in our study was 2.45:1 which is concordant with the study done by Kamra et al [8] wherein the M:F ratio was 2:1. In the present study the mean mast cell count showed progressive increase over the immunological spectrum of tuberculoid leprosy to lepromatous leprosy. Similar findings have been noted by Mysorekar et al [9], Kamra et al [8], Rav et al [10] and Aroni et al [11]. Mast cells are activated by cytokines like interleukin-3 (IL-3), IL-4 and granulocyte- macrophage colony-stimulating factor (GM-CSF) released from the T lymphocytes.
Amongst these IL-4 is the most essential [12]. The difference in the mast cell counts in the two groups could be explained on the basis of the difference in the cytokine patterns and T cell subsets between the two groups [13]. The mean mast cell count in Indeterminate leprosy (0.0093), lepromatous leprosy (<0.0001), borderline lepromatous (<0.0001), midborderline (<0.0001), borderline tuberculoid(0.0001) and ENL (<0.0001) was significantly higher than that of control cases. Also when the two basic groups of leprosy were compared with each other (BL+LL & BT+TT) it was found that the mean mast cell count in lepromatous group was significantly higher than that of the tuberculoid group (0.0043).
In the study by Mysorekar et al [9] the mean mast cell count in indeterminate leprosy (<0.01), borderline lepromatous leprosy (<0.01), lepromatous leprosy (<0.01) and midborderline leprosy (<0.05) were found to be significantly higher than that of controls. They also noted the mean mast cell count was significantly higher in the lepromatous group than the tuberculoid group (<0.05).
The distribution of mast cells was more commonly found in and around the granulomas in case of tuberculoid (Figure 6) and borderline tuberculoid leprosy (Figure 7) whereas in case of lepromatous leprosy (Figure 8), borderline lepromatous (Figure 9), indeterminate leprosy, midborderline and ENL (Figure 10) the distribution was periadnexal and perivascular in location A similar distribution was noted in the study by Joshi et al [14] and Chatura et al [6]. Mast cells showed a predominantly ovoid and spindle morphology in the current Study. No round/resting mast cells were noted in the cases. Joshi et al [14] stated that in leprosy cases the mast cells showed a predominantly spindle morphology.
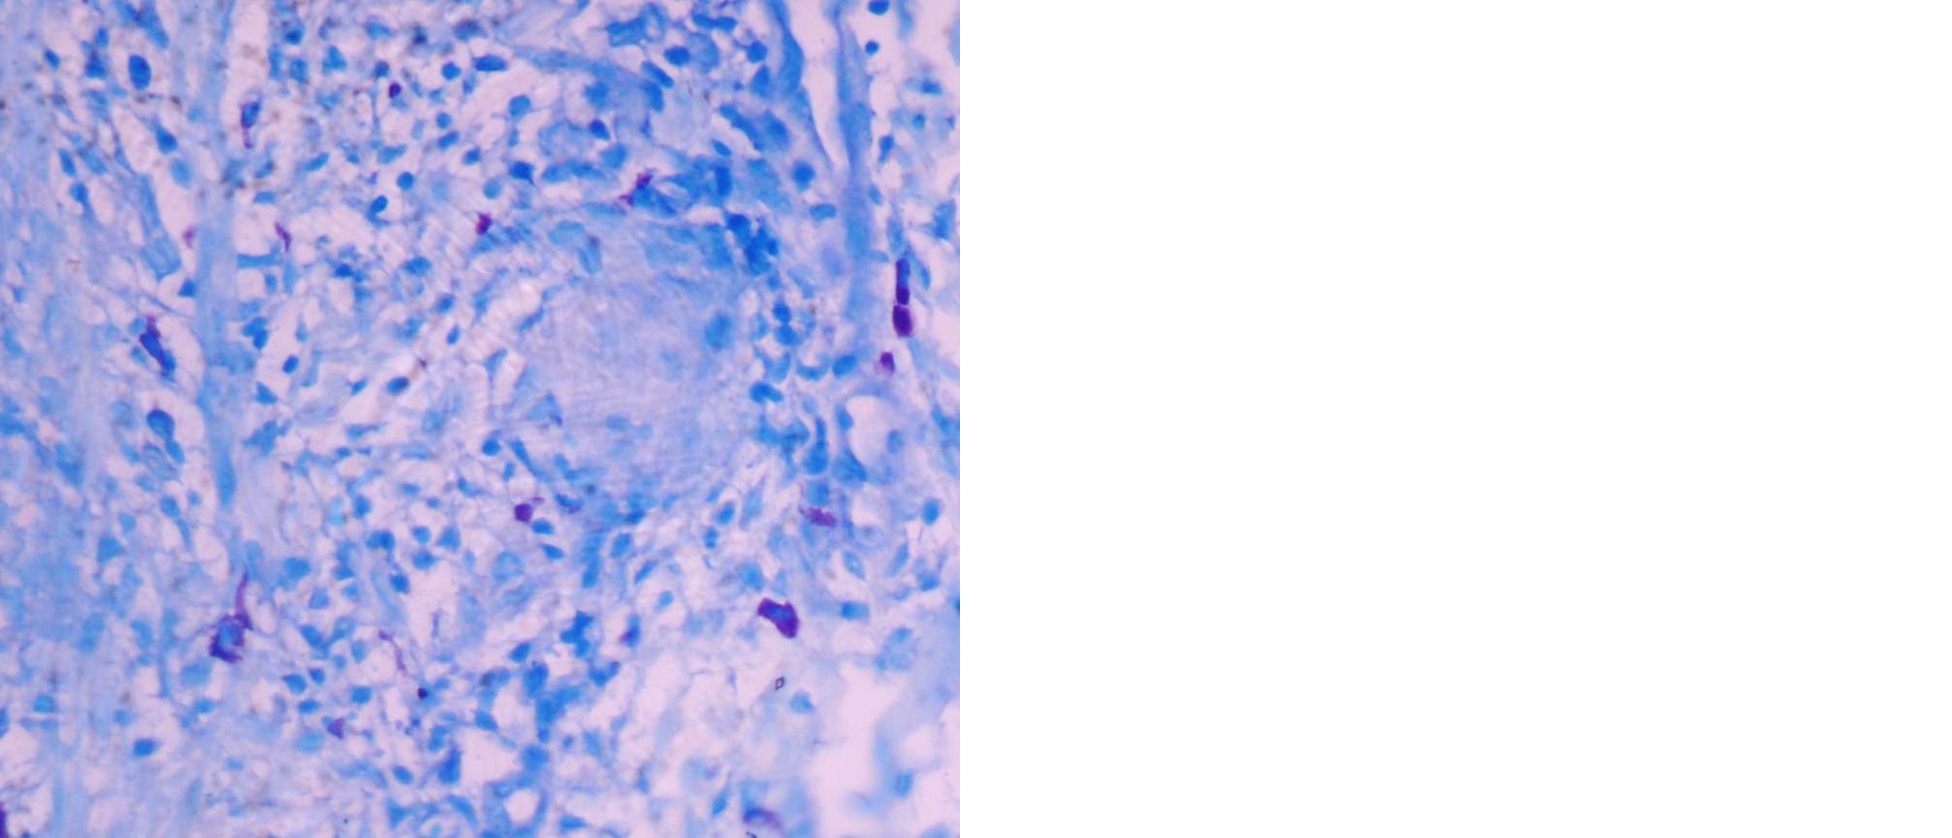
Figure 6: Photomicrograph of tuberculoid leprosy showing mast cells within and around the granuloma (Toluidine bluex400).

Figure 7: Photomicrograph of borderline tuberculoid leprosy showing mast cells around the granuloma (Toluidine bluex 400).

Figure 8: Photomicrograph of lepromatous leprosy with mast cells around the adnexal structures (Toluidine blue x400).
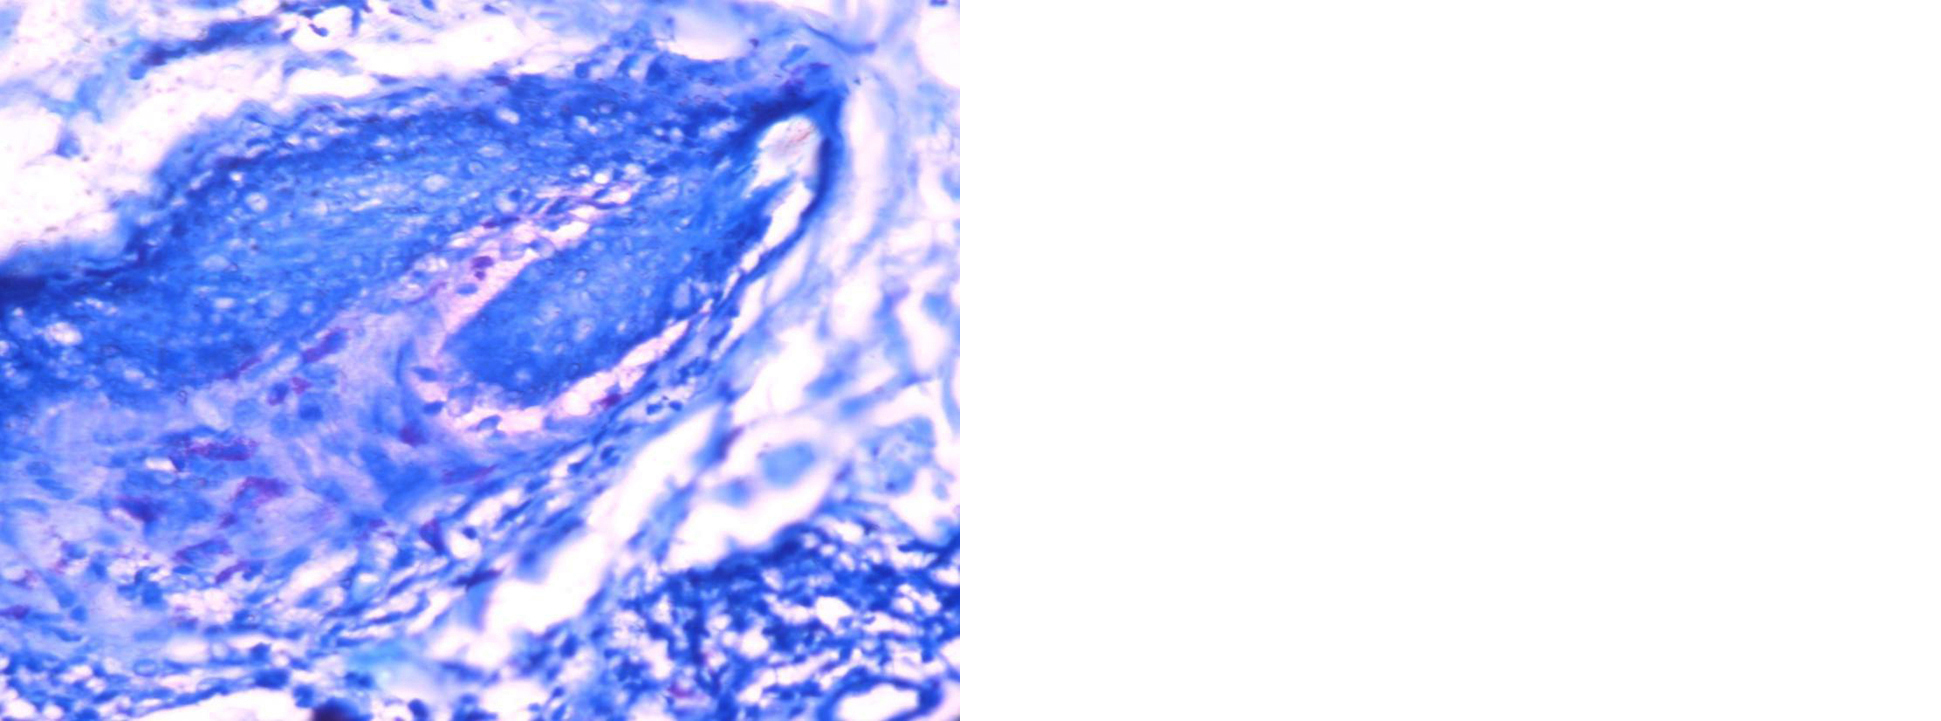
Figure 9: Photomicrograph of borderline lepromatous leprosy with mast cells located around the adnexal structures (Toluidine blue x400).
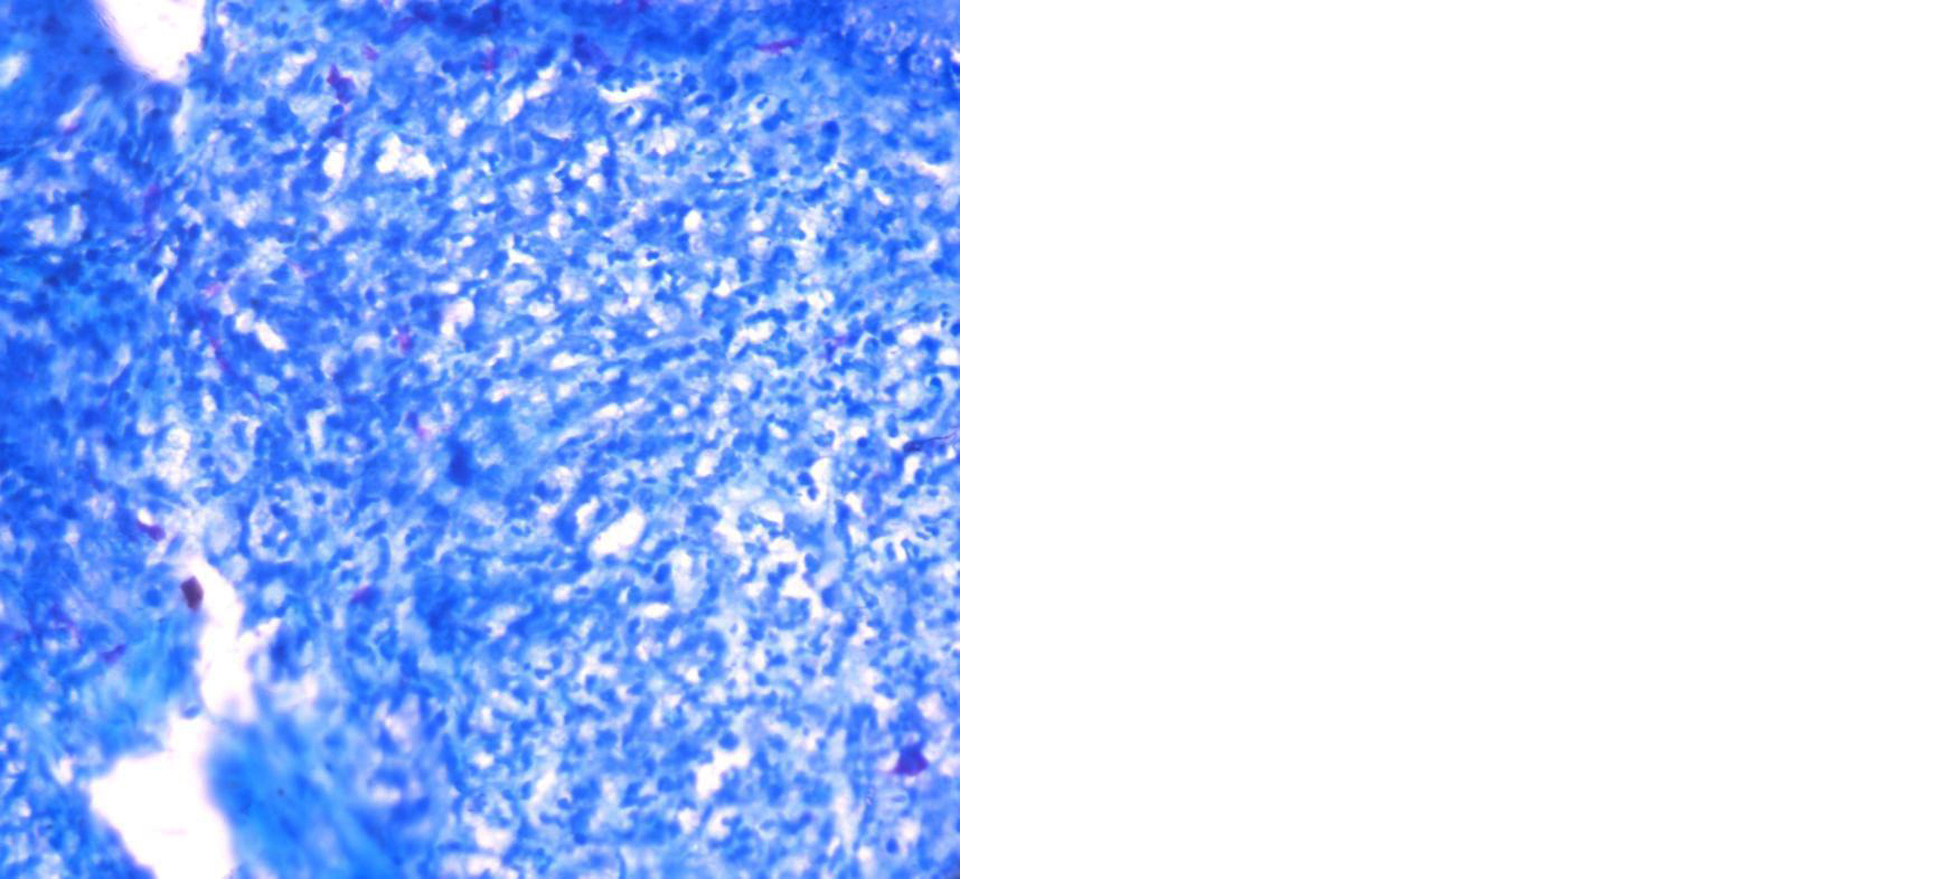
Figure 10: Photomicrograph of ENL showing mast cells in the inflammatory cell infiltrate (Toluidine blue x400).
The present study is based on a limited number of cases and single centre study. Hence it is inadequate to provide a conclusive data. Further studies are needed to understand the mechanisms and scope of contribution of mast cells to host defense and development of skin lesions.
Conclusion
The highest mean mast cell count in leprosy was noted in case of lepromatous leprosy (66/mm2). The mean mast cell count showed a progressive increase over the immunological spectrum from tuberculoid leprosy to lepromatous leprosy. The mean mast cell count in indeterminate leprosy, lepromatous leprosy, borderline lepromatous, midborderline, borderline tuberculoid and ENL was significantly higher than that of control cases. Also the mean mast cell count of lepromatous group was significantly higher than that of the tuberculoid group.
Conflicts of interest
Authors declare no conflicts of interest.
References
[1] Murphy GF, Lazar AJF. The Skin. In: Kumar V, Abbas AK, Fausto N, Aster J, eds. Robbins & Cotran Pathologic Basis of Disease. 8th Edn. Philadelphia: Elsevier, 2010; pp.1141–1179.
[2] Rodewald HR, Dessing M, Dvorak AM, Galli SJ. Identification of committed precursor for mast cell lineage. Science. 1996; 271: 818–822.
[3] Galli SJ. New concepts about mast cells. N Engl J Med. 1993; 328:257–265. [4] Metcalfe DD, Baram D, Mekori YA. Mast cells. Physiol Rev. 1997; 77:1033–1079.
[5] Sridharan G, Shankar AA. Toluidine blue: A review of its chemistry and clinical utility. J Oral Maxillofac Pathol. 2012; 16:251–255.
[6] Chatura KR, Sangeetha S. Utility of Fite-Faraco stains for both mast cell count and bacillary index in skin biopsies of leprosy patients. Indian J Lepr. 2012; 84:209–215.
[7] Jindal S, Manjari M, Girdhar M. Role of mast cells in leprosy- A study of 62 cases. J Evolution Med Dent Sci. 2017; 6:5328–5331.
[8] Kamra HT, Munde SL, Gangane N, Sharma SM, Gulia A, et al. Significance of mast cell density and distribution in various histopathological lesions of leprosy. JKIMSU. 2014; 3:57–63.
[9] Mysorekar VV, Dandekar CP, Rao SG. Mast cells in leprosy skin lesions. Lepr Rev. 2001; 72:29–34.
[10] Rav SD, Pratap VK, Sharma NK, Dayal SS. Mast cell in leprosy. Indian J Lepr. 1990; 62:467–472.
[11] Aroni K, Kontochristopoulos G, Liossi A, Panteleos D. An investigation of mast cells in two basic leprosy groups. Int J Lepr Other Mycobact Dis. 1993; 61:634–635.
[12] Cotran RS, Kumar V, Collins T. Diseases of immunity. ln: Kumar V, Abbas AK, Fausto N, Aster J, eds. Robbins & Cotran Pathologic Basis of Disease. 8th Edn. Philadelphia: Elsevier, 2010; pp.185–264.
[13] Yamamura M, Uyemura K, Deans RJ. Defining protective responses to pathogens: cytokine profiles in leprosy lesions. Science. 1991; 254: 277–279.
[14] Joshi MM, Buch AC, Panicker NK, Chandenwale SS. Mast cells in non neoplastic skin lesions. Indian Medical Gazette. 2013; 1:8–13.