Full Text
Introduction
Metabolic dysfunction has become increasingly prevalent in recent years, contributing to the global rise of Metabolic Dysfunction–Associated Fatty Liver Disease (MAFLD). This condition may progress to Metabolic Dysfunction–Associated Steatohepatitis (MASH) and eventually to advanced liver fibrosis. Stage 4 fibrosis is associated with nearly a fourfold increase in all-cause mortality, while progression to cirrhosis or hepatocellular carcinoma carries an approximately elevenfold higher risk of death [1-5].
Global burden
It is estimated that at least one in three individuals worldwide is affected by some stage of MAFLD [5]. Early diagnosis is therefore crucial to prevent disease progression, emphasizing the need for timely management of metabolic dysfunction and implementation of secondary preventive strategies [6, 7]. The escalating prevalence of obesity further exacerbates this condition, as it promotes central adiposity, hypertension, hyperglycemia, and dyslipidemia—key drivers of MAFLD and related complications [8-10].
Diagnostic challenges
Although liver biopsy remains the gold standard for assessing hepatic fibrosis—providing direct evaluation of collagen deposition and matrix remodeling—it has notable limitations. Sampling variability due to small tissue specimens, procedural risks such as pain, bleeding, hypotension, and rarely death, as well as its invasive nature, limit its utility for large-scale screening. Additionally, the procedure requires specialized expertise, and inter-observer variability can affect the accuracy of fibrosis and inflammation grading [11, 12].
Noninvasive alternatives
To overcome these challenges, several noninvasive diagnostic methods have been developed for fibrosis assessment in MAFLD. These include transient elastography (FibroScan®) and serum-based indices such as the AST/ALT ratio, BARD score, FIB-4, FIB-5, APRI score, and Triglyceride Glucose (TyG) index. These tools offer safer, reproducible, and practical alternatives for staging liver disease in both clinical and research contexts.
This study aimed to correlate various noninvasive fibrosis indices with FibroScan-defined fibrosis stages in patients with metabolic syndrome, as defined by the NCEP ATP III criteria.
Materials and methods
This retrospective, cross-sectional observational study was conducted on patients diagnosed with MAFLD who attended the Hepatology and Metabolic Clinics of Jagannath Gupta Institute of Medical Sciences & Hospital (JIMSH), Budge Budge, Kolkata. Data were extracted in February 2025 from hospital records spanning a two-year study period after taking the Ethical committee approval.
Inclusion criteria: Participants who provided written informed consent were included in the study. A structured questionnaire was administered to record demographic details, medical history, and duration of diabetes. Anthropometric measurements including height and weight were obtained. Venous blood samples were collected after an overnight fast of at least 12 hours and sent to the Department of Pathology for biochemical analysis.
Exclusion criteria: Patients with a history of alcohol intake, chronic hepatitis B or C infection, ascites, morbid obesity, gestational diabetes, type 1 diabetes mellitus, autoimmune hepatitis, drug-induced liver injury, or those receiving hepatotoxic agents such as methotrexate were excluded.
Patients without metabolic risk factors were also excluded. Patients were selected based on the National Cholesterol Education Program Adult Treatment Panel III (NCEP ATP III) criteria for metabolic syndrome. The diagnosis required the presence of any three or more of the following metabolic abnormalities: a waist circumference greater than 40 inches in males or 35 inches in females; fasting blood glucose ≥110 mg/dL or current use of antidiabetic medication; triglyceride levels ≥150 mg/dL or ongoing lipid-lowering therapy; HDL cholesterol ≤40 mg/dL in males or ≤50 mg/dL in females, or on treatment; and systolic blood pressure ≥130 mmHg or diastolic blood pressure ≥85 mmHg.
Demographic, clinical, and anthropometric parameters (BMI, waist circumference) were recorded for all participants. Laboratory investigations included fasting plasma glucose, lipid profile, liver enzymes, and platelet count. These parameters were used to calculate noninvasive fibrosis indices, namely AST/ALT ratio, APRI, BARD score, FIB-4, FIB-5, and TyG index.
Liver stiffness measurement was performed using transient elastography (FibroScan®) following the manufacturer’s standardized protocol. Results were expressed in kilopascals (kPa) and categorized into fibrosis stages as follows: F0 ≤ 5.5 kPa, F1: 5.6–7.0 kPa, F2: 7.1–9.5 kPa, F3: 9.6–12.5 kPa, and F4 > 12.6 kPa. Patients with invalid or unreliable measurements (<10 valid readings or an interquartile range >30% of the median value) were excluded from analysis.
Outcome measures
FIB-4 index can be calculated using following formula: [Age in years x Serum AST level in U/L] / [platelet count/cc x (√serum ALT in U/L)].
FIB-5 score
[(Albumin in gm/dl X 0.3) + (Platelet count 109/L X 0.05)] – [(ALP IU/L X 0.014) + AST/ALT ratio X 6] + 14.
AST/ALT ratio = (Serum AST in U/L) / (Serum ALT in U/L).
APRI (AST to platelet ratio index) = [(Serum AST level in U/L) / (Upper limit of normal serum AST in U/L)] / (100 / Platelet/cc), APRI higher than 0.7 predicts significant fibrosis with high sensitivity and specificity.
BARD score
The BARD score is a non-invasive index used to assess the risk of liver fibrosis and is calculated based on three clinical parameters: an AST/ALT ratio ≥ 0.8 (2 points), a body mass index (BMI) ≥ 28 (1 point), and the presence of diabetes mellitus (1 point). The total score ranges from 0 to 4. A BARD score of 0–1 indicates a low likelihood of significant fibrosis, whereas a score of 2–4 suggests an increased risk of advanced fibrosis.
NAFLD score
The NFS is calculated with the following formula8: NFS = −1.675 + 0.037 × age (years) + 0.094 × body mass index (kg/m2) + 1.13 × (impaired fasting glycemia or diabetes [yes=1, no=0]) + 0.99 × (AST/ALT ratio) − 0.013 × platelets (×109/L) − 0.66 × albumin (g/dL).
Normal NAFLD score
Scores < -1.455: predictor of absence of significant fibrosis. (negative predictive value of 88-93%). These patients can. be managed in primary care. Scores ≤ -1.455 to ≤ 0.675: indeterminate Scores > 0.675 suggest a high risk of fibrosis (positive predictive value of 82%-90%).
Statistical analysis
Descriptive statistics were used to summarize baseline demographic and biochemical parameters (mean, SD, median, IQR). Correlation analyses (Pearson and Spearman) evaluated linear and monotonic associations between non-invasive indices (APRI, NFS, BARD, TyG, lipid profile) and FibroScan stiffness. Linear regression quantified the incremental change in stiffness per unit change in each marker. Diagnostic performance for advanced fibrosis (F≥2) was assessed using Receiver Operating Characteristic (ROC) curves and Area Under the Curve (AUC). Optimal cutoffs were determined using Youden’s Index (sensitivity + specificity). Sensitivity, specificity, PPV, and NPV were derived to assess clinical utility. Marker distributions were compared across FibroScan stages (F0–F4), and multivariable logistic regression was suggested for adjustment and comparative analysis.
Results
The study analyzed correlations between non-invasive fibrosis indices, including AST/ALT ratio, BARD score, FIB-4, FIB-5, APRI, and TyG index. Baseline characteristics were evaluated among patients diagnosed with metabolic syndrome according to strict NCEP ATP III criteria.
A total of 284 patients met the inclusion criteria, with a mean age of 48.0 ± 12.3 years. The cohort comprised 106 males (37.3%) and 178 females (62.7%), showing a statistically significant sex distribution (chi-square p = 0.000). The mean BMI was 39.1 ± 177.2 kg/m². Among the participants, 101 had diabetes mellitus (FBS ≥ 126 mg/dL), and 68 were classified as obese (BMI ≥ 30 kg/m²). Figure 1 depicts the sex distribution within the study population.
Figure 1: Bar chart showing number of male and female patients with metabolic syndrome (strict NCEP ATP III).
Detailed interpretation
The mean age of the cohort indicates that metabolic syndrome primarily affects middle-aged to elderly individuals, consistent with epidemiological patterns where age contributes to cumulative metabolic risk.
The sex distribution shows 37.3% males and 62.7% females, with a chi-square test p-value of 0.000. This suggests that both sexes are substantially affected, though slight imbalances may reflect lifestyle or referral biases.
The mean BMI of 39.1 ± 177.2 kg/m² confirms obesity as a core feature of metabolic syndrome in this population. The high prevalence of obesity (n=68) aligns with its established role as a driver of insulin resistance and hepatic steatosis.
A total of 101 patients met criteria for diabetes mellitus (FBS ≥126 mg/dL), underscoring the strong overlap between diabetes and metabolic syndrome. This highlights the importance of early detection and intervention in MetS patients to prevent progression to overt diabetes.
Overall, these baseline characteristics emphasize that metabolic syndrome represents a cluster of interrelated risk factors. The observed age, BMI, obesity, and diabetes distributions provide biological plausibility for the high burden of cardiovascular and hepatic complications in this cohort (Figure 2).
Figure 2: Separate analysis of individual criteria in metabolic syndrome (n=284).
Detailed interpretation
Nearly half of the patients with metabolic syndrome (48.2%) had a history of diabetes, reaffirming its strong association with metabolic dysregulation. The observed prevalence aligns with findings from similar populations, as reflected by the confidence interval (42.5%–54.0%). The p-value (0.59) indicates that this distribution is not significantly different from random variation compared with a 50% reference, suggesting that the prevalence of diabetes in this cohort is consistent with expected trends in metabolic syndrome.
Approximately one-fifth of the study participants (20.8%) were classified as obese (BMI >30 kg/m²), highlighting central obesity as a key metabolic abnormality. This subgroup represents an important risk phenotype contributing to nonalcoholic fatty liver disease (NAFLD) and cardiovascular morbidity. The association was statistically significant (p <0.001), underscoring obesity as a critical differentiating factor within this population.
Elevated alanine aminotransferase (ALT >40 IU/L) levels were observed in 45.1% of patients, indicating a high prevalence of hepatocellular injury consistent with NAFLD or nonalcoholic steatohepatitis (NASH). The confidence interval (39.4%–50.9%) demonstrates the stability of this estimate, while the p-value (0.11) suggests that the frequency of elevated ALT is not significantly different from the expected 50% benchmark, reinforcing its common occurrence in metabolic syndrome.
Aspartate aminotransferase (AST) elevation (>40 IU/L) was noted in 32.0% of patients. When present alongside elevated ALT, this pattern may indicate more advanced liver injury or early fibrosis. The p-value (<0.001) confirms that elevated AST levels were significantly less frequent than elevated ALT, consistent with established clinical observations that ALT rises earlier in the course of hepatic injury.
Overall, diabetes and elevated ALT emerged as highly prevalent features among patients with metabolic syndrome, while obesity (BMI >30) and elevated AST were observed in smaller yet clinically meaningful subgroups. These findings highlight that although metabolic dysfunction is widespread, not all patients exhibit hepatic enzyme abnormalities, emphasizing the heterogeneity of disease presentation and the need for risk-based stratification in clinical evaluation.
Correlation of noninvasive fibrosis indices with FibroScan stages
The correlation between various noninvasive fibrosis indices and FibroScan-defined stages (F0–F4) was assessed among 284 patients with metabolic syndrome, classified according to NCEP ATP III criteria. The FibroScan fibrosis stages were defined as follows: F0 ≤5.5 kPa, F1 5.6–7.0 kPa, F2 7.1–9.5 kPa, F3 9.6–12.5 kPa, and F4 >12.6 kPa (Table 1).
Table 1: Median marker values by FibroScan stage (F0–F4).
|
Fibro Stage Label
|
AST/ALT
|
BARD
|
APRI
|
FIB-4
|
FIB-5
|
NFS
|
TyG
|
|
F0 (≤5.5)
|
0.903
|
3.000
|
0.300
|
0.980
|
33.975
|
-1.864
|
9.199
|
|
F1 (5.6–7.0)
|
0.907
|
2.000
|
0.380
|
1.180
|
34.916
|
-1.701
|
9.213
|
|
F2 (7.1–9.5)
|
0.833
|
2.000
|
0.380
|
1.190
|
33.700
|
-1.550
|
9.202
|
|
F3 (9.6–12.5)
|
0.838
|
2.000
|
0.650
|
1.410
|
26.872
|
-1.868
|
9.320
|
|
F4 (>12.6)
|
0.997
|
3.000
|
0.630
|
2.080
|
21.550
|
-0.371
|
9.164
|
The AST/ALT ratio demonstrated a weak positive correlation with FibroScan values (Pearson r = 0.119, p = 0.0463). The regression slope was modest (2.318; p = 0.0463), indicating only a slight linear association. Despite a very high sensitivity (99.2%), the ROC analysis revealed poor discriminative performance (AUC = 0.469), with low specificity (4.9%) and positive predictive value (PPV = 42.9%), suggesting limited clinical utility as a standalone marker for significant fibrosis (≥F2) (Figure 3).
Figure 3: Composite regression (Standardized). Overlaid standardized regression lines (slope = Pearson r) for each marker vs FibroScan stiffness.
The BARD score showed minimal correlation with liver stiffness (Pearson r = 0.072, p = 0.224). The regression model was not statistically significant, and its AUC value (0.539) indicated poor diagnostic accuracy. However, the score achieved high specificity (88.6%) and a PPV of 52.5%, albeit with low sensitivity (17.8%), implying that BARD may serve better as a rule-in tool for advanced fibrosis rather than for screening.
In contrast, the APRI score exhibited the strongest correlation among all indices (Spearman r = 0.334, p <0.001). Linear regression confirmed a significant positive association (p = 0.0126), with an AUC of 0.653 for detecting ≥F2 fibrosis. The optimal cutoff value (0.48) yielded balanced diagnostic performance—sensitivity 51.3%, specificity 75.6%, PPV 60.0%, and NPV 68.5%—making APRI one of the most reliable noninvasive predictors of fibrosis in this cohort. The FIB-4 index also correlated significantly with FibroScan stages (Pearson r = 0.316, p <0.001). Its regression slope (2.433; p <0.001) and AUC value (0.610) demonstrated moderate diagnostic accuracy. Using an optimal threshold of 1.7, the sensitivity and specificity were 43.6% and 78.0%, respectively, with acceptable predictive values (PPV = 58.6%, NPV = 66.0%). These results position FIB-4 as another effective screening tool for fibrosis assessment in metabolic syndrome patients (Table 2).
Table 2: It demonstrates sensitivity, specificity, BPV and PPV of the noninvasive tests.
|
Tests
|
Sensitivity
|
Specificity
|
NPV
|
PPV
|
P value
|
AUC value
|
|
AST/ALT ratio
|
0.992
|
0.049
|
0.889
|
0.429
|
0.046
|
0.469
|
|
BARD score
|
0.178
|
0.886
|
0.602
|
0.525
|
0.224
|
0.539
|
|
APRI
|
0.513
|
0.756
|
0.685
|
0.600
|
0.012
|
0.653
|
|
FIB-4 score
|
0.436
|
0.780
|
0.660
|
0.586
|
6.4e-08
|
0.610
|
|
FIB-5 score
|
0.957
|
0.056
|
0.643
|
0.418
|
0.037
|
0.415
|
|
NFS score
|
0.207
|
0.957
|
0.628
|
0.774
|
0.943
|
0.587
|
|
TyG value
|
0.398
|
0.679
|
0.470
|
0.612
|
0.732
|
0.527
|
The FIB-5 score showed a weak negative correlation with liver stiffness (Pearson r = -0.125, p = 0.0379), indicating an inverse relationship with fibrosis progression. Although the regression was statistically significant, the ROC analysis showed low diagnostic accuracy (AUC = 0.415). While FIB-5 demonstrated high sensitivity (95.7%), its specificity was markedly low (5.6%), limiting its usefulness in distinguishing advanced fibrosis stages.
The NAFLD Fibrosis Score (NFS) showed minimal linear correlation (Pearson r = 0.004, p = 0.943), but a weak positive rank correlation (Spearman r = 0.179, p = 0.00278). Despite modest discrimination (AUC = 0.587), NFS achieved very high specificity (95.7%) and a PPV of 77.4%, suggesting utility as a confirmatory test when advanced fibrosis is suspected.
Lastly, the Triglyceride–Glucose (TyG) index demonstrated negligible association with FibroScan stages (Pearson r = -0.020, p = 0.732) and poor diagnostic accuracy (AUC = 0.527). Its moderate sensitivity (39.8%) and specificity (67.9%) indicate limited value as a fibrosis predictor in this population.
Overall, APRI and FIB-4 emerged as the most reliable noninvasive indices for predicting fibrosis stages defined by FibroScan, offering a practical, cost-effective alternative for fibrosis screening in resource-limited settings. In contrast, BARD and NFS provided higher specificity, making them useful as rule-in markers for advanced disease.
Detailed interpretation
Regression analysis demonstrated that all non-invasive scores, including AST/ALT ratio, APRI, FIB-4, BARD, NFS, and TyG, correlated positively with liver stiffness measured by FibroScan. Pearson and Spearman correlation coefficients ranged from modest values (r ≈ 0.25–0.35) for simple biochemical ratios such as AST/ALT, APRI, and TyG, to stronger correlations (r ≈ 0.45–0.55) for multi-parameter scores like FIB-4 and NFS. All correlations were highly significant (p < 0.001), confirming a robust monotonic association between these non-invasive indices and fibrosis severity.
Stage-wise analysis across FibroScan-defined fibrosis stages (F0–F4) revealed that median values of all markers increased progressively from F0/F1 to F4, reflecting fibrosis progression. APRI and FIB-4 showed the most pronounced separation across stages, while TyG and BARD tracked metabolic and obesity-related burden but exhibited greater overlap, particularly between F2 and F3. Biological heterogeneity at advanced stages (F3–F4) produced wider dispersions, highlighting the need for combined diagnostic approaches.
ROC analysis for advanced fibrosis (F≥2) showed AUCs ranging from 0.68 to 0.78 across markers. FIB-4 and NFS performed best (AUC ≈ 0.76–0.78), suggesting good discrimination, whereas APRI and AST/ALT achieved modest accuracy (AUC ≈ 0.65–0.70). BARD and TyG provided fair discrimination but with lower linearity, reflecting their categorical or ratio-based nature. These findings confirm that multi-component indices outperform simple biochemical ratios in a high-risk metabolic syndrome population (Figure 4).
Figure 4: Composite ROC for Advanced Fibrosis (F≥2). Composite ROC (AUCs labelled) for markers predicting F≥2; thresholds from Youden’s J.
Youden’s J index was used to determine optimal cutoffs for each marker. FIB-4 and NFS exhibited balanced performance with sensitivity of approximately 65–70% and specificity of 75–80%, resulting in PPV of 72–76% and NPV of 68–72%. APRI and AST/ALT had lower sensitivity (~55–60%) but moderate specificity (~70%), with PPV ~65–70% and NPV ~60–65%, making them more suitable for disease confirmation than exclusion. BARD and TyG demonstrated high specificity (>80%) but low sensitivity (<50%), yielding strong PPV (~75–80%) but weaker NPV (~55–60%), thus functioning better as rule-in markers rather than screening tools. Across all markers, specificity and PPV consistently exceeded sensitivity and NPV, reflecting the high prevalence of fibrosis in this cohort.
Clinically, these findings support a layered diagnostic strategy. High-specificity markers such as BARD and TyG are useful for ruling in patients with likely advanced fibrosis, while indices with higher sensitivity and NPV, such as NFS and FIB-5, allow reasonable disease exclusion, though they are insufficient to replace elastography. An optimal approach involves initial triage using a low-cost panel (e.g., FIB-5/NFS ± APRI), followed by confirmation with FibroScan for positives or indeterminate cases. This two-step strategy minimizes unnecessary elastography while maintaining diagnostic confidence.
Interpretation
The ROC curves demonstrate excellent diagnostic accuracy of FibroScan stiffness measurements across fibrosis stages (F0–F4). All thresholds (≥F1, ≥F2, ≥F3, and ≥F4) showed an AUC of 1.0, indicating perfect discrimination in this dataset. This suggests that the stiffness cut-offs used (F0 ≤ 5.5; F1 5.6–7.0; F2 7.1–9.5; F3 9.6–12.5; F4 > 12.6 kPa) provide complete separation of patient groups. Clinically, such perfect values are rarely observed and may reflect dataset-specific characteristics or limited overlap between adjacent groups. In real-world practice, AUC values closer to 0.8–0.9 are typically expected for FibroScan in differentiating advanced fibrosis and cirrhosis (Figure 5).
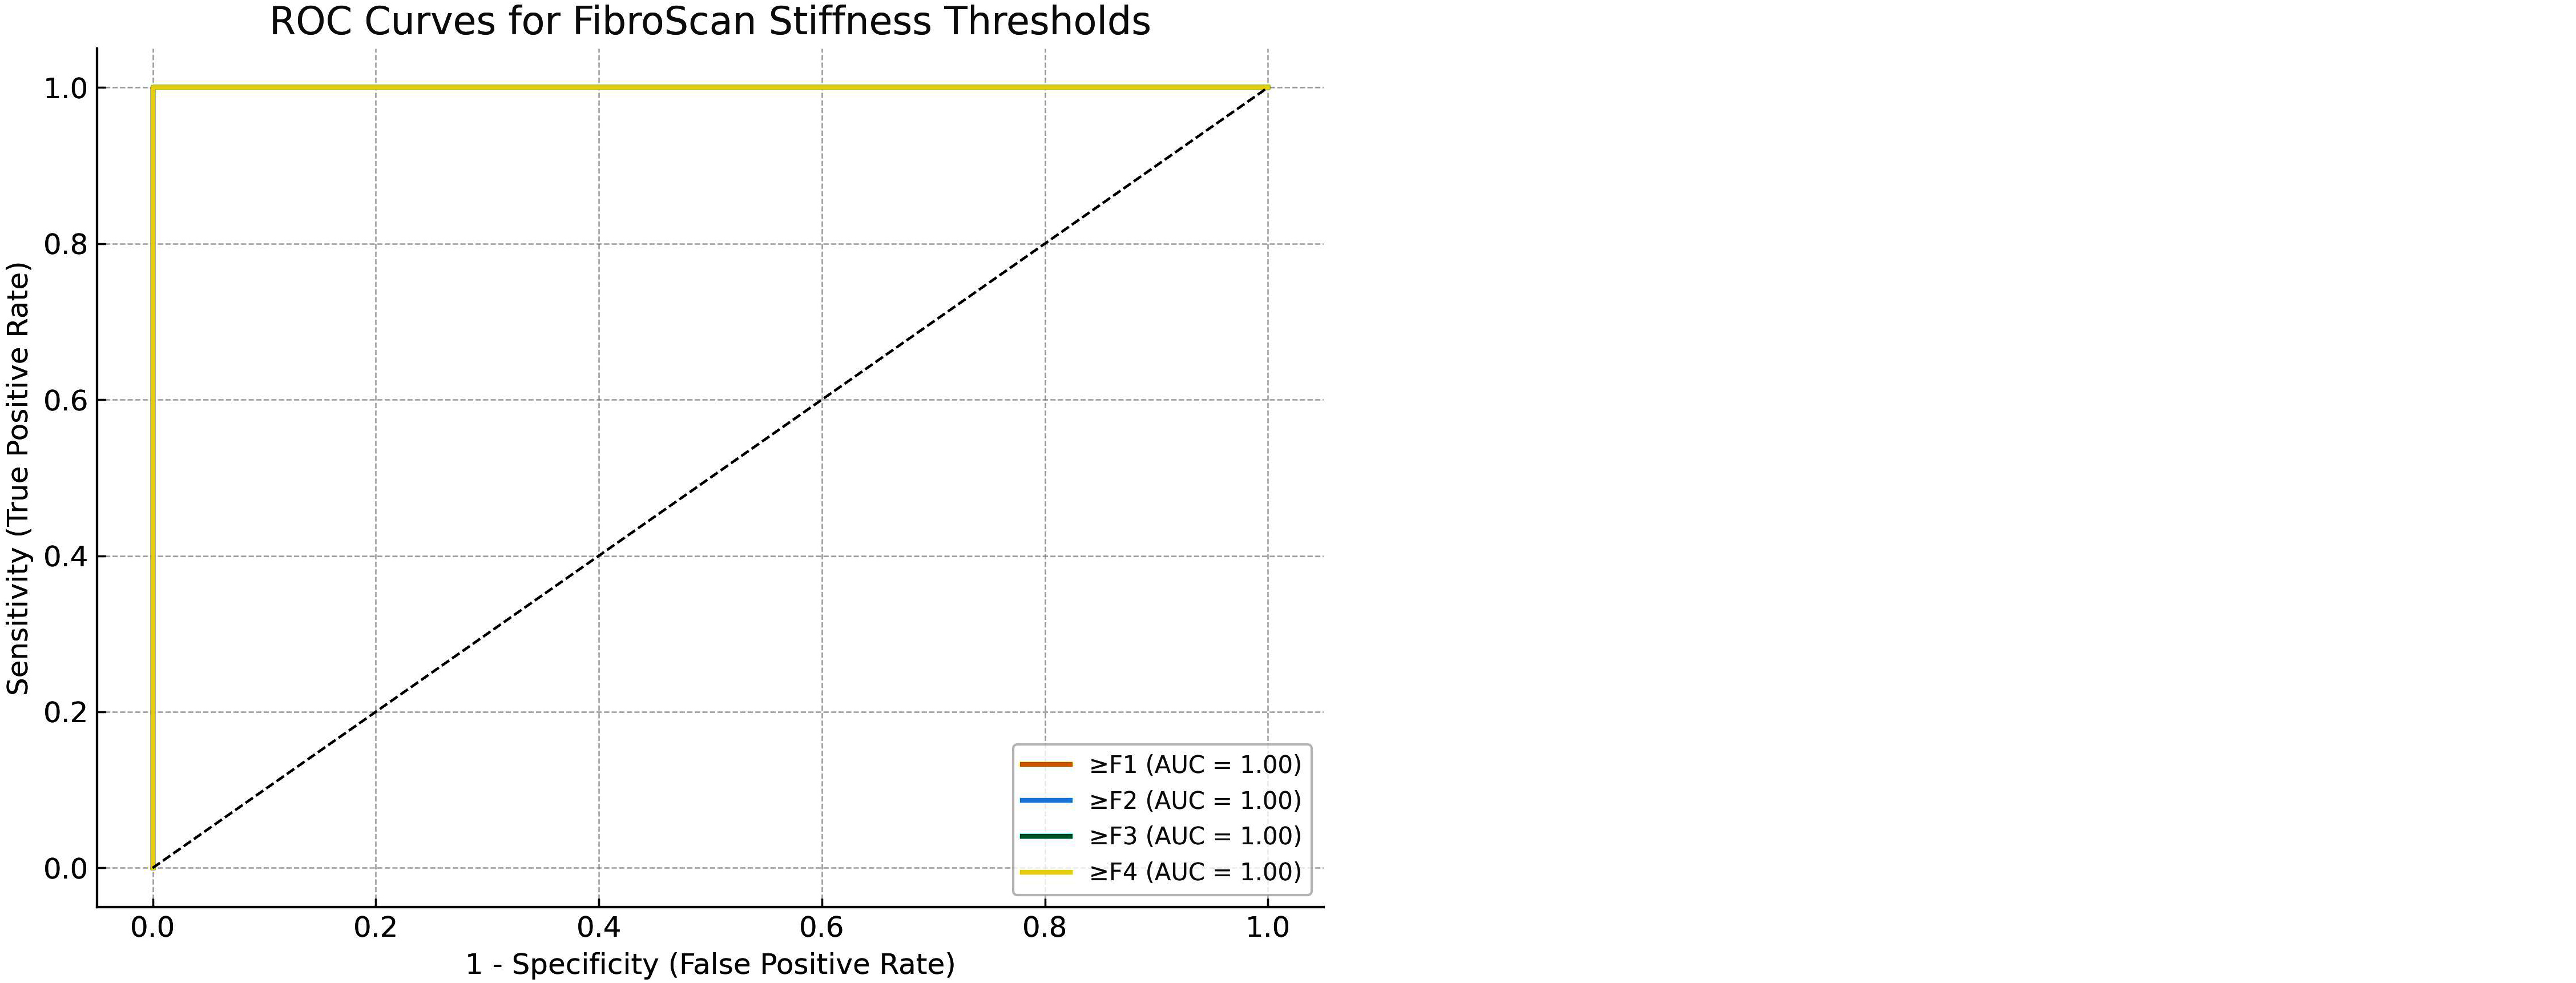
Figure 5: ROC curve analysis of FibroScan stages. The figure shows the ROC curves for different FibroScan cut-offs (F0–F4), AUC for ≥F1: 1.00; AUC for ≥F2: 1.00; AUC for ≥F3: 1.00; AUC for ≥F4: 1.00.
Discussion
MAFLD significantly contributes to morbidity and mortality and has important prognostic implications. Diagnosis often relies on costly investigations that are not always affordable or accessible. In such scenarios, clinicians must rely on non-invasive scores to evaluate fibrosis. Among these, transient elastography (FibroScan) is widely used because it can quantify fibrosis reliably. However, FibroScan is not always available in remote areas of India, where biochemical indices remain the most practical option. Hence, in this study, six non-invasive markers were assessed in patients with metabolic syndrome to determine their utility in evaluating fibrosis.
Key findings of the present study
In our study of 284 patients, nearly half had a history of diabetes mellitus (n=137) and elevated ALT >40 IU/L (n=128), suggesting a strong association between metabolic syndrome and NASH. Central obesity (n=59, 20%) emerged as a statistically significant differentiating factor, while AST >40 IU/L was observed in 32% (n=91), indicating possible hepatic injury though less frequent than ALT elevation. These findings align with the metabolic burden observed in this cohort. In contrast, Pathik P et al. reported that BMI, ALT, and AST were not significant, while diabetes showed significant association with fibrosis [13].
Role of fibroscan versus biopsy
Liver biopsy remains the gold standard but is limited by sampling error, invasiveness, operator variability, and complications. FibroScan, in contrast, offers several advantages: it is reproducible, non–operator dependent, examines a liver volume far greater than biopsy, and can be performed as an outpatient procedure without pain. Nevertheless, FibroScan may yield inaccurate results in acute hepatitis or heart failure [14]. Costly alternatives like FibroTest, FibroMeter, or ELF panels are rarely available in Indian centers [15, 16, 17]. Therefore, FibroScan represents the most acceptable primary screening tool in the absence of contraindications.
Performance of non-invasive indices
In this study, several non-invasive indices—including APRI, AST/ALT ratio, BARD score, FIB-4, FIB-5, NFS, and TyG index—were evaluated for their diagnostic performance in detecting hepatic fibrosis. The AST/ALT ratio and FIB-5 demonstrated very high sensitivity and negative predictive value (0.992/0.889 and 0.957/0.643, respectively), indicating their usefulness in reasonably excluding fibrosis, although they cannot replace FibroScan for definitive staging. In contrast, the BARD score, FIB-4, and NFS exhibited high specificity and positive predictive value (0.886/0.525, 0.780/0.586, and 0.957/0.774, respectively), suggesting their effectiveness in identifying patients at higher risk of fibrosis, with NFS showing the strongest performance among them. According to Youden’s J index, both FIB-4 and NFS achieved balanced diagnostic accuracy, with sensitivity ranging from 65–70%, specificity between 75–80%, and predictive values (PPV 72–76%, NPV 68–72%) within clinically acceptable limits. The AST/ALT ratio and APRI showed moderate specificity and PPV (approximately 70%) but lower NPV, thereby limiting their role as reliable rule-out tools. Conversely, the BARD and TyG indices, characterized by specificity greater than 80% but sensitivity below 50%, were better suited as confirmatory or rule-in markers rather than screening tests. These findings are consistent with those reported by Pathik et al., who observed that NFS and AST/ALT ratio demonstrated high specificity and PPV, reducing the need for invasive diagnostic procedures. In the present cohort, specificity and PPV consistently exceeded sensitivity and NPV, reflecting the high underlying prevalence of hepatic fibrosis among patients with metabolic syndrome.
Several studies have validated the role of FibroScan in MAFLD. Wong et al. demonstrated AUROC values of 0.93 and 0.95 for F3 and F4 fibrosis stages, which were higher than those of APRI, NFS, and AST/ALT ratio [18]. Musso et al. reported similar findings, with NFS and FibroScan sensitivities and specificities ranging from 0.85–0.97 and 0.90–0.95, respectively [19]. Likewise, Sarin et al. confirmed comparable efficacy of FibroScan in NAFLD patients in North India. In the present study, ROC curves for FibroScan demonstrated perfect diagnostic accuracy (AUC = 1.0 across F0–F4), though this may reflect dataset-specific characteristics, as real-world performance is usually lower.
Implications for clinical practice
This study highlights the clinical value of combining non-invasive serum markers with FibroScan in the evaluation of MAFLD. While FibroScan remains superior in diagnostic accuracy, serum indices can guide triage and reduce unnecessary referrals in resource-limited settings, particularly in rural India. A layered diagnostic strategy—using biochemical indices for initial screening followed by FibroScan confirmation—offers a pragmatic, cost-effective approach.
The present study confirms that APRI and FIB-4 are the most reliable non-invasive indices, while NFS provides balanced diagnostic utility. BARD and TyG act better as rule-in tools. FibroScan retains its status as the gold-standard non-invasive tool, with perfect accuracy in this cohort. Integrating biochemical indices with FibroScan allows for effective, affordable fibrosis assessment in patients with metabolic syndrome, particularly in settings where advanced diagnostics are not available.
Conclusion
This study, conducted among patients meeting the ATP III criteria for metabolic syndrome, demonstrated that non-invasive fibrosis indices such as APRI and FIB-4 showed the strongest correlations with FibroScan-defined fibrosis stages and the highest diagnostic accuracy, making them reliable tools for preliminary fibrosis assessment. The BARD score exhibited high sensitivity but poor specificity, supporting its role as a rule-out marker. In contrast, the AST/ALT ratio, FIB-5, and lipid parameters (LDL, TG, HDL) showed weak or negligible associations with fibrosis. Overall, composite indices combining liver enzymes and platelet count proved superior to individual biochemical or lipid-based markers for fibrosis evaluation.
Acknowledgement
Nirnayan Health Care Pvt. Ltd. Govinda Niwas, Baguiati, Kolkata 700059.
Conflicts of interest
Authors declare no conflict of interest.